The summer of 2018 has continued to deliver plenty of reliable holiday weather, but the heatwave conditions have also caused significant impacts on people and the environment. The persistent hot and dry conditions have led to concerns over water supplies. Here we continue our blog post series helping to put the current weather and water situation in context.
What is the situation and is it exceptional?
Continuing the trend of summer 2018, July was another exceptional month, with very hot temperatures and little rainfall until the end of the month.
At our meteorological station in Wallingford, we saw no rain days (i.e. with >1mm of rainfall) between 1st June and 20th July – this spell of 48 days equals the record (from spring 1997) of consecutive dry days at the site, which has been observed daily since 1962.
As a result of intense rainfall in the closing days, the July rainfall was not as exceptional as June. The UK as a whole saw 73% of average, but parts of the Midlands and south-east received less than half the typical July rainfall, while Northern Ireland and parts of western Scotland saw near-average rainfall.
However, the figures for the last three months show that we have experienced a significant meteorological drought at the UK scale. It was the third driest May-July period for the UK (in a record from 1910), and the second driest in some regions, e.g. Anglian (after 1921) and North West (after 1984).
The dryness of the last three months is also shown by the CEH UK Drought Portal, with the majority of the UK registering as 'severely dry' or 'extremely dry' over this period.
")
Above: CEH UK Drought Portal showing the SPI-3 drought indicator (rainfall averaged over the last three months)
...the figures for the last three months show that we have experienced a significant meteorological drought at the UK scale.
Following the late July downpours, the dryness and heatwave conditions have continued into early August in England and Wales.
Soil moisture
The low rainfall and high evaporation associated with the hot weather has caused soils to dry out, causing stress to vegetation and crops. The new interactive graphs for our COSMOS-UK network show that soil moisture levels declined steeply through most of June and July across much of the country. The MORECS soil moisture product from the Met Office provides a longer-term view, showing that end-of-July soil moisture was notably low across the country and comparable with many past drought episodes. North-west England had the lowest soil moisture on record for this time of year (in a record from 1961).
River flows
July also saw exceptionally low river flows. Many responsive rivers receded towards near-record low flows in late July, but increased sharply in the final days of the month. Nevertheless, July average flows were notably or exceptionally low across northern and western Britain, and the lowest on record in a number of rivers (e.g. the Scottish Dee, in a record from 1929, and the Tywi in Wales, a record from 1959).
Averaging the river flow for both June and July, record low flows for this period were seen in many catchments (e.g. the Spey and Whiteadder in Scotland, the Lune and Ribble in north-west England and Tywi and Yscir in south Wales).***

Above: River flow averages for July 2018 (left) and June/July 2018 combined (right)
Groundwater
Groundwater levels were generally in the normal range in south-east England, a residual effect of the very wet spring. Flows in most groundwater-fed rivers were also normal or moderately below.
Reservoir stocks
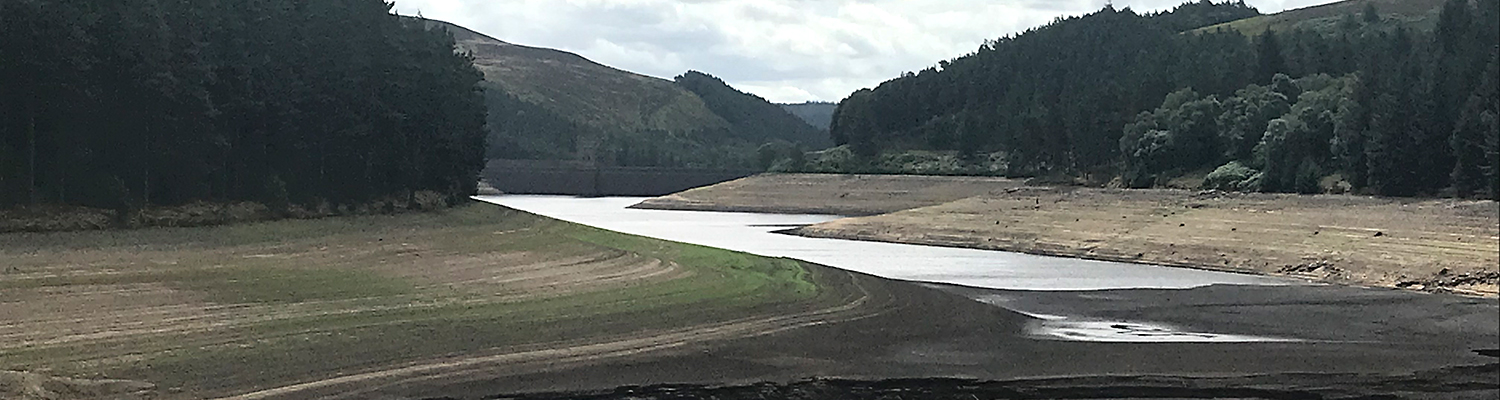
Reservoir stocks were below average across the north and west, with many reservoirs less than 10% below average for late July. Some reservoirs were more than 20% below average, e.g. in north-west England, Wales and the southern Pennines: the Derwent Valley reservoir group (pictured below) saw its third lowest late July stocks (after 1990 and 1996) in a record from 1988. For reservoir storage in England and Wales as a whole, the stocks at the end of July were only 1% above what they were in 1995, an exceptional drought year.

Above: Derwent Valley reservoirs on 28th July. Looking upstream from Derwent Dam. Photo © Katie Muchan
The aridity of the last few months has unsurprisingly led to ongoing concerns about the water resources situation, although welcome rainfall in the north and west improved the outlook in the short-term. A hosepipe ban in place in Northern Ireland from late June was lifted on the 19th July. A planned hosepipe ban for United Utilities in northwest England was set to begin on 5th August, but was not enacted following the rainfall at the end of July. Several sections of canal in northern England were closed in early August due to low levels in feeder canals.
The exceptionally dry soils have led to agricultural drought conditions in many parts of the UK, severely affecting farmers and growers. The dry soils have also increased the incidence of severe wildfires. Low flows and high temperatures have led to algal blooms in many areas and there have been numerous reports of fish rescues across England and Wales.
How does 2018 compare to past droughts?
The hot, dry summer conditions have inevitably led to comparisons with 1976, which is the benchmark drought for much of southern Britain. Meteorologically, there is some basis for the comparison of these exceptional heatwave summers, and for the May-July period the 2018 UK rainfall was lower than 1976. However, 1976 was much more severe over longer timeframes including the previous spring and winter. Over periods longer than three months, 2017/2018 rainfall deficits are well outside the rankings of notable drought episodes, both nationally and regionally.
This has resulted in important differences to 1976 in hydrological terms. So far, 2018 has the hallmarks of a 'summer' drought which is arguably more comparable to 1984 or 1995 – the low river flows being observed mostly in the north and west where there is limited groundwater storage and rivers and reservoirs decline rapidly in response to sustained hot, dry conditions.
...important differences to 1976 in hydrological terms.
In 2018 the spring was very wet in south-east England, which has sustained flows in groundwater-fed rivers. In 1976, the arid summer followed a very dry spring and winter in the south-east. In this area, reduced winter half-year (Oct-March) groundwater recharge is a key driver of droughts and the most severe past droughts have arisen from dry winters (e.g. 2004–2006, 1990–1992), sometimes also in combination with intervening hot and dry summers (e.g. in 1976, 1990 and 2006).
The graphs below show the 2018 river flows against the five years with the lowest July flows for two contrasting catchments – a responsive catchment in Wales (Teifi) and a groundwater-fed catchment in southeast England (Lambourn). The 1976 drought features as one of the most severe low flow years in both, but the position of 2018 in the rankings is very different.


Above: Hydrographs comparing 2018 river flows with the five years with lowest July flows. Comparing the responsive river Teifi (southwest Wales) with a Chalk catchment, the Lambourn (southern England)
Of course, such comparisons are based on the story so far and the character of the current drought could change significantly. The 1976 drought ended dramatically in autumn and the 1984 drought remained a within-year event. In contrast the 1995 summer drought marked the start of a long period of reduced rainfall that eventually led to further impacts in 1996 in northern England and a groundwater drought in southern England in 1997.
In the Historic Droughts project, we are currently reconstructing hydrological drought back to the 1890s, allowing us to put recent events in a much longer-term context. We will discuss this in more detail in a forthcoming blog post.
What's the Outlook?
The Hydrological Outlook suggests below normal river flows will persist through August in northern and western areas, with notably low flows possible in some places. The outlook for the next three months suggest flows in some northern and western areas may return towards the normal range, but in southwest England low flows could persist.
In southeast England, the outlook is more variable, thanks to the influence of geology discussed above. In groundwater-fed catchments, flows are likely to be normal over the next three months, while more responsive surface-water fed rivers may see below normal flows.

Above: Summary map from the August 2018 UK Hydrological Outlook
If projections favouring lower flows are realised we will see continuing environmental stress in late summer and early autumn, and the prospect of further water restrictions and other socio-economic impacts.
There is much uncertainty in seasonal-scale hydrological forecasts. But given the currently depleted river flows, it is clear that significantly above average rainfall is needed to replenish river flows and reservoir levels. If August remains dry, the focus will be on the autumn/winter season when this replenishment typically occurs.
...given the currently depleted river flows, it is clear that significantly above average rainfall is needed to replenish river flows and reservoir levels.
There will be an increased interest in seasonal weather and hydrological forecasts going forwards, particularly as we head towards the winter when there is more predictability in long-range weather forecasts.
We are trialling a range of experimental forecast systems developed as part of our research undertaken within the UK Drought and Water Scarcity Programme. We are currently sharing these with stakeholders including the Environment Agency, water companies and agricultural organisations to explore how they could be used in practice. If you are interested in this work, please contact us.
We are continuing to track the water resource situation using our monitoring products. Next week we will release the latest Hydrological Summary, providing a more detailed account of the current hydrological situation.
For regular updates on the soil moisture situation, COSMOS-UK data are updated in near real-time.
The Environment Agency also issues a weekly rainfall and river flow summary for England and national and Area Monthly Water Situation Reports.
Jamie leads the Hydrological Status and Outlooks Group within CEH's Water Resources science area.
*** River flow data are currently provisional. The July Hydrological Summary will be published next week.
Related links
UK Hydrological Status Update - early December 2018
UK Hydrological Status Update - early July 2018