After a summer in which the weather and its impacts hit the headlines, with heatwave and drought conditions in many areas of the UK, it might seem that the water resources situation has recovered now that the weather has become wetter and cooler. Here we continue our blog post series updating the water situation to the end of the autumn and considering the influence of this winter on the prospects for water resources in 2019...
Headline messages
We had heatwave conditions in early summer. What has happened since then?
June and July were exceptional months, ranking amongst both the hottest and driest June-July period in records dating back to 1910. Parts of the south-east registered almost no appreciable rainfall for more than six weeks (for example in Wallingford, tied for the most consecutive days in a series from 1962, with no rainfall for 48 consecutive days). Persistent hot, dry weather caused steep declines in reservoir stocks and river flows in responsive catchments, as well as pressure on supply infrastructure in the face of high demand in parts of the north and west.
The low river flows resulted in a very high number of environmental incidents such as fish rescues. Dry soils helped the spread of wildfires in northern England, severe agricultural stress more widely, and have been linked to an increase in insurance claims resulting from subsidence.

Above: June-July rainfall totals and mean temperatures for the UK
Although August was the wettest of the three summer months, rainfall was only near average for the UK as a whole and it was still dry across northern Scotland and in parts of northern and central England. While August provided some welcome relief from the arid conditions and soaring demand that characterised much of June and July, this was generally not sufficient for the recovery of river flows or the replenishment of surface water reservoirs, many of which remained well below average at the end of the summer.
")
")
Above: Percentage of long-term average rainfall (left) and river flows (right) for summer 2018 (June-August)
Autumn
Typical of the season, the weather in autumn was more changeable including some stormy interludes (for example, named storms Bronagh, Callum and Diane). Nevertheless, Northern Ireland, parts of eastern Scotland and the majority of England and Wales received below average rainfall for the autumn. It was particularly dry in central England, with large areas receiving less than 70% of the long-term average rainfall.
The reduction in evaporation in autumn usually means that river flows and groundwater levels climb substantially but modest rainfall limited the seasonal recovery this autumn. Mean river flows for autumn were normal to above normal in Wales and western Scotland but below normal across Northern Ireland and most of England. Flows were less than half of average in a number of UK catchments and around a third of average for the Soar, Colne, Tweed, Scottish Tyne and Deveron.

")
Above: Percentage of long-term average rainfall (left) and river flows (right) for autumn 2018 (September-November)
Groundwater levels at the end of November were generally normal to below normal across the country, particularly so in the southern Chalk where levels at Chilgrove House (West Sussex) were very low for the time of year, in a record from 1836.


Above: Percentage of long-term average river flows (left) and rankings of end of month groundwater levels (right) for November 2018.
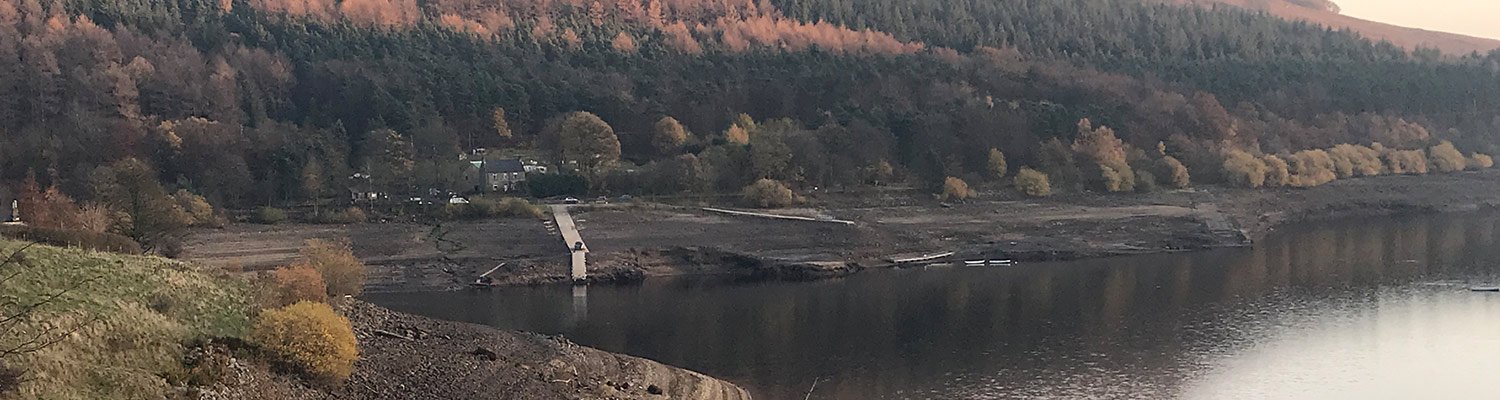
Reservoir stocks remained below average across England with many reservoirs more than a fifth below the average for late November. Some stocks were more than a quarter below average for the time of year (eg, the Bradford Supply group, Ardingly and Clatworthy) and were 40% below the late November average at Derwent Valley. For England and Wales overall, stocks at the end of November were 8% below average for the time of year (16% for the English Lowlands), corresponding to the fourth lowest late November stocks (in a series from 1988) behind the notable drought years of 1990, 1995 and 2003.


Above: Derwent Valley reservoirs on 28th July 2018 (left) and 15th November 2018 (right). Photos © Katie Muchan.

Above: England and Wales reservoirs stocks for the last twelve months
It's worth reflecting on the last six months overall (summer and autumn) as we enter the winter.
The UK Drought Portal is an operational monitoring tool which assesses the severity of rainfall deficits relative to average conditions for a particular location and time of year. The June-November period this year was moderately dry for most of England and Wales, but notably severe deficits were registered throughout central England and in parts of East Anglia. In response to this, accumulated river flows over the last six months (shown using the SSI-6, a comparable indicator for river flows to the rainfall indicator used in the UK Drought Portal) were below normal throughout most of the UK, with severely to exceptionally low flows recorded in responsive catchments in the north-west of England, the Midlands and north-east Scotland.
")
Above: CEH's UK Drought Portal showing the SPI-6 drought indicator (rainfall over the last six months against the long-term average)
The focal areas of water resource stress have shifted over the last six months, underlining the dynamic nature of droughts in the UK. In the height of the summer, much attention was given to localised water resource pressure in the north and west of the country resulting from a combination of rapidly declining reservoir stocks and extremely high demand during heatwave conditions. These parts of the country are more sensitive to shorter periods (3-6 months) of hot, dry weather due to the responsive nature of river catchments and dependence on surface storage for water supplies. Moderate rainfall in the late summer and autumn generally ameliorated concerns in Wales and north-west England. However, in parts of the Pennines reservoir stocks remained substantially below average at the end of November, such as in Yorkshire where drought permits have recently been submitted.
"The focal areas of water resource stress have shifted over the last six months, underlining the dynamic nature of droughts in the UK"

Above: The SSI-6 drought indicator for June-November 2018 (average river flows over the last six months against the long-term average)
In contrast, although central, southern and eastern England received the least rainfall (relative to average) through June and July, river flows and groundwater levels were sustained by subsurface storage (see below). However, now that the period of deficient rainfall exceeds six months, river flows and groundwater levels have begun to fall below normal, notably or exceptionally so in some instances.
In fact, to some extent we appear to be back where we started a year ago. The situation in early December 2018 is quite similar to the same time in 2017, with below normal river flows across large areas of the English Lowlands. However, while the dry winter of 2017/2018 heightened concerns for summer 2018 water resources in the south-east, a wet spring improved the situation dramatically by bringing late groundwater recharge, just in time to sustain groundwater levels and river flows through the dry summer.
Now, in December 2018, the same question is being asked – what lies ahead through the winter and early spring and what is the water resources outlook for next summer?
It’s been quite wet recently. Hasn’t that changed the situation?
November and the first two weeks of December have been unsettled, with a number of vigorous frontal systems traversing the UK, including storm Diane. On 28th November, eight Flood Warnings and 22 Flood Alerts were issued across southern Britain and Scotland. On 7th December, heavy rainfall (particularly in south Wales) led to a number of localised instances of pluvial (surface water) flooding, with seven Flood Warnings and 58 Flood Alerts declared across the west of Britain.
This rainfall will certainly have helped to reduce high soil moisture deficits and recharge rapidly responding aquifers where levels were particularly low (eg at Chilgrove House, West Sussex in the southern Chalk). For much of the English Lowlands, the average amount of rainfall for the whole of December has already been received over the first three weeks, with further rainfall forecast over the next week. More days like this are likely to be required over the next few weeks and months to replenish water resources this winter.
What's in the forecast for the rest of winter?
The latest Hydrological Outlook, published on 11th December, highlighted that there was no clear signal towards a wetter or drier than average winter based on Met Office seasonal meteorological forecasts available at the time. However, the Outlook does point towards a likelihood of continued low river flows in central and eastern England through the winter, and low groundwater levels in parts of the southern and eastern Chalk. This reflects the storage deficits that built up over the summer and autumn, which are likely to continue unless substantially above average rainfall is received through the remainder of the winter.
There is of course significant uncertainty in any forecasts for UK weather at the seasonal (one–three month) timescale. Winter is the time of year when there is greatest predictability in weather at this timescale, but forecasts typically span a wide range of outcomes. There is a very mixed picture in the meteorological forecasts presented via the Outlook as it was not clear which of the opposing atmospheric/oceanic drivers that have a bearing on UK weather would be more influential, meaning no clear signal as to whether we are likely to see a warm and wet or cold and dry winter overall. However, the December forecasts did suggest a higher chance of cold and dry weather in the late winter. Subsequently, updated seasonal meteorological forecasts for the January-March period were published on 14th December by the Met Office. These forecasts continued to suggest that below average rainfall is more likely for the UK overall in early 2019. We will be producing another Hydrological Outlook in early January based on these updated meteorological forecasts.
While there is some confidence in the hydrological forecasts given the current conditions, a recovery in the hydrological situation cannot be ruled out if the rest of the winter continues to be as wet and stormy as late November and early December.

Above: Summary map from the December 2018 UK Hydrological Outlook
Where can I find out more?
The team will continue to produce our regular Hydrological Summary (sign up here), Hydrological Outlook (sign up here) and COSMOS update within the first two weeks of each month. The UK Drought Portal will also be updated at the beginning of each month with the latest monthly rainfall data. We will summarise these products through further blog posts throughout the winter, as determined by the developing water resources situation.

Above: An example of the new 12-month Ensemble Streamflow Prediction forecast outputs developed through the UK Drought and Water Scarcity programme, for the Little Ouse catchment from December 2018
In addition, we're working with regulators and water companies through the UK Drought and Water Scarcity Programme to support decision-making by providing bespoke new products and services, including more detailed Ensemble Streamflow Prediction outputs and piloting a regional water resource portal. For more information, contact the About Drought project team.

Above: DRAFT South West water resource portal
Simon Parry and colleagues Jamie Hannaford, Stephen Turner, Nikos Mastrantonas, Lucy Barker, Cath Sefton and Katie Muchan.
Related links
UK Hydrological Status Update - early August 2018
UK Hydrological Status Update - early July 2018