Since 2015, the UK Centre for Ecology & Hydrology (UKCEH) has used satellite-derived imagery to identify crop types grown across 1.7 million agricultural fields in Great Britain each year, producing annual UKCEH Land Cover® plus: Crop maps. As the latest crop map, with data from 2020, is released, Emily Upcott explores some of the questions they can help to answer…
Together, our datasets on agricultural land cover in Great Britain give us unique insights into the way the landscape across the country is changing. We know that between 1990 and 2015 there has been a net reduction of 782km2 of arable farmland (Rowland et al, 2020) in Great Britain. But this hides many more subtle changes in the types of crops we grow – changes in policy, pest management, fertiliser use, commercial demand and weather can affect which crops are planted and where, year by year.
The UKCEH Land Cover® plus: Crops data enable us to explore crop distributions and patterns, and together build a detailed field-level picture of crop sequences. When combined with other national or local datasets, such as hydrology, pesticide applications or wildlife surveys, we can better understand the potential benefits and impacts of arable agriculture on the environment. With six sequential years of the crop map now available, we have a unique and highly informative dataset for exploring patterns of changes in crops over time and space.

Image: Crop maps in each year were stacked up to give crop sequences for every field in Great Britain. These sequences were then used to explore the questions posed below.
How have crop areas changed?
Cropping decisions – what to grow and where – are important in determining the impact of agriculture on the environment. Crops grown can influence pesticide and fertiliser application, irrigation, soil erosion and even biodiversity. Decisions are made based on a combination of factors, such as market, policy, weather events and longer-term climatic conditions.
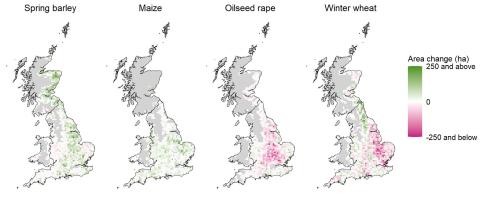
Looking at just a few crop types for the period 2015 to 2019 (image below), we can see there are different changes in area and spatial distribution. Overall, spring barley and maize increase, while oilseed rape and winter wheat decrease. Oilseed rape appears to spread, with increases seen at its eastern edge. Similarly, the pattern in winter wheat is not uniform: it seems to be expanding in northeast England.

With data for this 2015-2019 period, we can see patterns emerging across Great Britain. However, it is difficult to say to what extent they reflect short-term or long-term changes in cropping and farm decisions. For instance, oilseed rape has been in decline since before 2015, with pest damage and unsuitable weather often reasons for poor harvests. On the other hand, maize is becoming more popular and is increasingly grown for biofuel. Data on crop area and distribution change could be useful in exploring more specific impacts on the environment by different crops.
How diverse are crop rotations?
It is widely recognised that modern intensive farming practices are detrimental to wildlife, habitats, or the ecological processes that sustain them. When crop rotations are longer and more diverse, we can see benefits to pollinators and natural predators of crop pests, and even increases in crop yield compared to more intensive rotations.
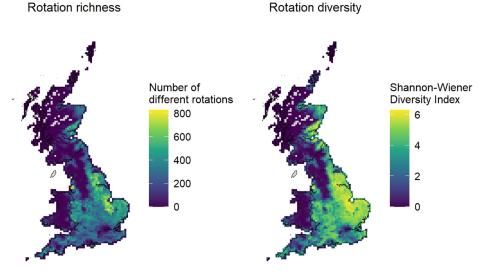
In the maps shown below, rotation richness is the number of different rotation types per 10km2 cell, while rotation diversity takes rotation richness and evenness (relative area of different rotations) into account.

The two maps show similar patterns, with higher values in the east where there is more arable land, and lower in the west where land is generally more suitable for grazing. Where there are more crop types grown, there are many more possible rotation combinations. Higher values are more widespread in the diversity map, which in a way is expected: in a limited space, having more different rotations means each would occupy a smaller and therefore more relatively even area.
That wildlife, habitats and ecological processes are not universally in a better state in areas of high rotational diversity emphasises the complexity of farmland ecosystems. Beyond the scope of this blog post, crop rotational diversity data could be included in farmland ecology research that investigates the impact of agricultural intensity on the environment.
Can we estimate changing soil erosion risk using cropping data?
One crop that particularly increases the risk of soil erosion is maize. Soil is exposed for much of the maize growing season and crops are harvested as late as November. Machinery compacts soil, particularly when the ground is wet, limiting its ability to absorb water. This can cause increased surface run-off and silting, therefore contributing to flood risk.
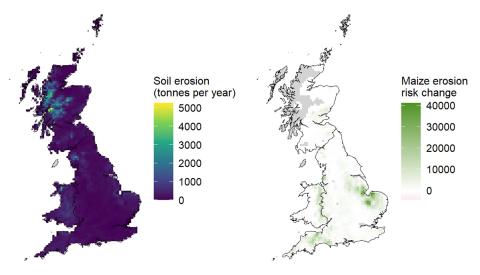
To help address the question, I brought in data from the European Soil Data Centre on soil erosion by water (2010) and wind (2001-2010). Maize erosion risk change was calculated using total maize per 10km2 cell per year.

Soil erosion risk is greatest in upland areas, most notably in the Scottish Highlands, Lake District and Snowdonia, and to a lesser extent in mid-Wales and eastern England. However, what little arable land there is in upland areas is rarely occupied by maize. Where maize erosion risk is changing, it is almost entirely increasing. This is most prominent in eastern England, the southwest and the England-Wales border. These are areas where maize cropping overlaps with lower levels of soil erosion.
These results give us a fairly clear picture of erosion risk in Great Britain, despite crop and erosion data not overlapping in time. If maize should continue becoming more common in the landscape or crop sequences, we would expect maize erosion risk to continue increasing and perhaps expand. Understanding where maize erosion risk might have a greater impact in the landscape is an important factor in flood risk management.
Scratching the surface
The questions we have explored just scratch the surface of how UKCEH Land Cover® plus: Crops can provide answers to ecological questions. We see that these datasets can be used alone, or in combination with external datasets to see how arable agriculture interacts with its surroundings. The crop datasets have been and could be applied further to many different research themes, and could ultimately factor into environmental policy and management.
"The crop datasets have been and could be applied further to many different research themes, and could ultimately factor into environmental policy and management."
The 2020 dataset brings new categories of spring oats (previously included in spring wheat), and solar panels in land parcels, mapped throughout Great Britain. Data on the spatial and, in future years, temporal distribution of solar panels will be able to tell us more about the changes in the popularity of this type of renewable energy. Similarly to how we have explored crop sequences here, combining other data sources with solar panel distribution data could address a further array of scientific questions.
Additional information
All years include crop categories of winter wheat, winter barley, spring barley, oilseed rape, grass, maize, sugar beet, field beans, potatoes and other. In 2016, spring wheat was introduced to differentiate between wheat and barley. In 2019, additions of winter oats, previously included in winter wheat, and peas, previously included with field beans. Each year, crop types were cross-validated to maximise accuracy, though some are classed more accurately than others.
How to obtain UKCEH Land Cover® plus: Crops
References
Agricultural Land Classification: predictive map (Wales)
Borrelli, P, Lugato, E, Montanarella, L, & Panagos, P. (2017). A new assessment of soil loss due to wind erosion in European agricultural soils Using a quantitative spatially distributed modelling approach. Land Degradation & Development, 28: 335–344, DOI: 10.1002/ldr.2588
European Soil Data Centre (ESDAC), European Commission, Joint Research Centre
National Scale land capability for agriculture (Scotland)
Panagos, P, Borrelli, P, Poesen, J, Ballabio, C, Lugato, E, Meusburger, K, Montanarella, L, Alewell, C. 2015. The new assessment of soil loss by water erosion in Europe. Environmental Science & Policy. 54: 438-447. DOI: 10.1016/j.envsci.2015.08.012
Provisional Agricultural Land Classification (England)
Rowland, C S; Marston, C G; Morton, R D; O’Neil, A W. (2020). Land Cover Map 1990 (25m raster, GB) v2. NERC Environmental Information Data Centre. DOI: 10.5285/1be1912a-916e-42c0-98cc-16460fac00e8