Centre for Ecology & Hydrology hydrologist David Boorman reviews the soil moisture status at the end of May 2018 using data from CEH’s new COSMOS-UK network, and explains how these data will contribute to future assessments of hydrological status...

CEH’s COSMOS-UK soil monitoring network enables a near real-time assessment of soil moisture status across the UK.
The situation at the end of May 2018 is shown in our soil moisture index map, right. Reds indicate low soil moisture typical of summer conditions and blues high soil moisture more usual in the winter months.
In northern parts of the UK, soil moisture is low and therefore rainfall would be welcomed by land owners and land managers, farmers and gardeners.
To the south of the UK there is a more mixed picture because of the localised nature of recent rainfall, but generally soils are wet and many would appreciate a return to drier weather.
COSMOS-UK and Hydrological Status
During 2017, Hydrological Status updates were posted in April, August and December. These provided a commentary based on the UK’s excellent and lengthy records of rainfall, river flows and groundwater levels provided by the Met Office and the UK’s hydrometric measuring authorities. These data continue to inform the monthly Hydrological Summary and Hydrological Outlook.
Rainfall and river flow data describe fluxes of water, ie the water arriving at the land surface and the water leaving a catchment area respectively.
Groundwater level data is an indicator of the water stored in the UK’s major aquifers. Combined with surface reservoir storage data from the UK’s water companies (which are also summarised in the Hydrological Summary), this provides an insight into the water resources situation. Together these data enable an assessment of the susceptibility to flooding, from rainfall, river flow and groundwater, and the prospect, or status, of a drought.
CEH’s own COSMOS-UK soil moisture monitoring network now provides an additional dataset to further enhance our understanding of the hydrological situation. When soil moisture is high, further heavy rainfall may result in flooding, and low soil moisture can stress vegetation and, if prolonged, lead to an agricultural drought.
"When soil moisture is high, further heavy rainfall may result in flooding, and low soil moisture can stress vegetation and, if prolonged, lead to an agricultural drought."

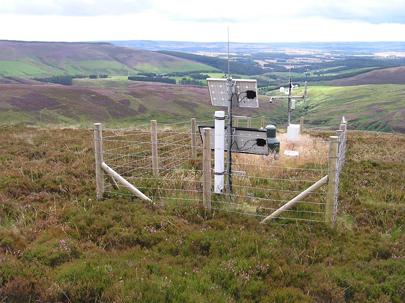
COSMOS-UK uses a state-of-the-art soil moisture sensor with a large footprint providing data at the field/landscape scale. In addition to the “cosmos” sensor, each site is equipped to monitor a full range of meteorological and soil variables.
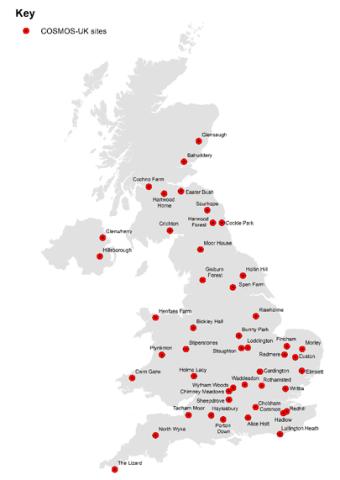
The network, which started operation in 2013, currently comprises almost 50 monitoring sites, which is far fewer than for both rainfall and river flow (see location map).
The spring is generally an interesting time for soil moisture as it is the time of year at which evaporation begins to exceed rainfall and therefore soil moisture decreases. This decrease in soil moisture also indicates the time at which aquifer recharge tends not to resume until the autumn or winter.
May 2018: an interesting month

This spring 2018, and the month of May in particular, has been particularly interesting for soil moisture. At the end of April soil moisture was high across almost all of the UK and, after rainfall at the very start of May, the next three weeks of May were hot and dry. Low rainfall and high evaporation combined to produce a rapid fall in soil moisture.
Across southern parts of the UK this fall was brought to an abrupt halt with the arrival of heavy thunderstorms from around the 23rd May to the end of the month.
For Scotland and northern England it is possible to generalise the changes in soil moisture during May as transitioning from values typical of winter at the start of the month to values typical of summer at the end of the month. Elsewhere it is more difficult to generalise about soil moisture because of the spatial variability of both soil characteristics and the nature of rainfall associated with thunderstorms.
This can be seen by looking at recent data from a selection of COSMOS-UK sites. Each of the plots below shows the volumetric soil water content (expressed as a percentage) for the period 2016 to 2018. The black line shows the daily soil moisture, the shaded areas show the monthly minima (pink) and maxima (blue) from the period of record, and the dashed grey line indicates the period of record monthly mean.
COSMOS-UK is a new network, as indicated by the period of record for each site, and these extremes and means are currently derived from very short records. They do nevertheless give some indication of the seasonal variability of the observed moisture content. The locations of the sites are shown on the accompanying map.
The daily data look "noisy"; this comes to a large extent from the day-to-day variability in our weather, most notably rainfall, but can also be attribute to the characteristics of the "cosmos" sensor.

Above: At Sourhope in south-east Scotland, soil moisture has decreased steadily from the middle April until the end of May.

Above: At Porton Down in Wiltshire, soil moisture decreased during April and May but increased rapidly from May 23.

Data from North Wyke in Devon, above, showed a similar decrease during May, but with more modest rainfall at the end of the month there has only been a slight increase in soil moisture.
The summary map at the top of this blog post represents the soil moisture status from all COSMOS-UK on May 31. It is anticipated that as the COSMOS-UK network expands and record lengths increase, the COSMOS-UK data will become an integral part of CEH’s hydrological situation reporting.
Related links
Hydrological Situation Update: December 2017
Staff page and research interests of David Boorman
