Maps have been produced at a 1km resolution through statistical interpretation and extrapolation from a range of sample data. An accompanying report explains how each map has been produced. Reports, map images and GIS layers are available to view and download below.

Soil Carbon
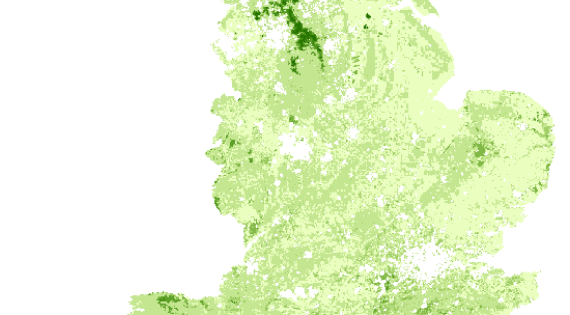
Mean estimates of carbon density in topsoil (tonnes per hectare)
Soil organic carbon is essential for its role as the primary energy source in soils. It is vital for maintaining soil structural condition, resilience and water retention. As soil carbon is the biosphere’s largest carbon reservoir, soils play a vital role in climate regulation.
Soil nitrogen
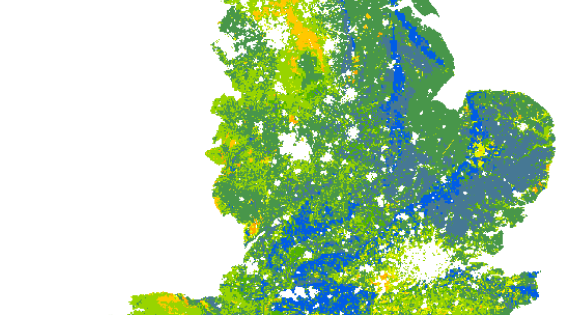
Mean estimates of total nitrogen concentration in topsoil (%)
Soil total nitrogen concentration is a basic measurement of soil fertility. Along with soil organic carbon, it plays a key role in the processes of soil formation. Not all of the nitrogen locked up in organic matter in soils, such as peat, is available for plant growth. However, soil nitrogen is important for agricultural productivity. Nitrogen leached from soils can also adversely affect water quality.
Soil pH
Mean estimates of topsoil pH
Measures of pH give an indication of soil acidity. In terms of natural capital, its effects range from influencing agricultural productivity to recovery from acidification. Soil pH affects the mobility and bioavailability of metals in soils. In general, metals become more available to plants in neutral or slightly acidic soils.
Soil phosphorus
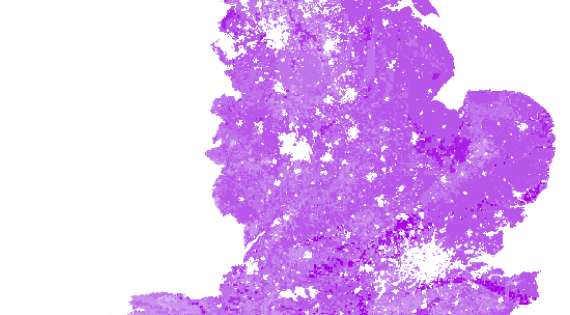
Mean estimates of phosphorus concentration in topsoil
Soil phosphorus is a key component for nutrient cycling, soil formation and plant growth. It particularly influences food production. However loss of phosphorus from soil can also result in nutrient enrichment of freshwaters. In semi-natural habitats high soil phosphorus can constrain the restoration of plant species diversity.
Soil bacteria
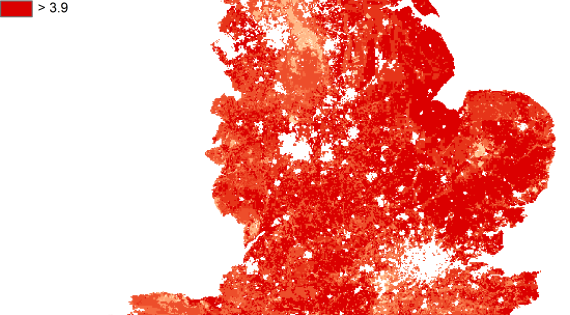
Mean estimates of soil bacterial diversity in topsoil.
Soil bacteria represent a major portion of the biodiversity in soils. At the bottom of the soil food web, bacteria play a vital role in nutrient cycling, carbon sequestration and breaking down pollutants. Soil bacterial diversity particularly affects agricultural production, soil quality and climate regulation.

Soil invertebrates
Mean estimates of total abundance of invertebrates in topsoil
Soil invertebrates have an important role in soil processes. This includes storing, filtering and transforming nutrients, as well as plant growth. Soil invertebrates are fundamental to maintaining soil quality, which underpins almost all other regulating ecosystem services.

Headwater stream quality
Invertebrates in headwater streams
Freshwater invertebrates are good indicators of water quality. Different species vary in their tolerance or sensitivity to nutrient enrichment and other pollutants. Invertebrates are part of complex foodwebs which support fish and plants, as well as breaking down detritus and algae. This map is based on invertebrates in the smallest headwater streams.
Carbon in vegetation
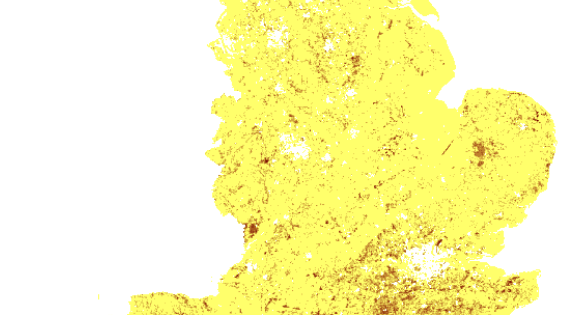
Mean estimates of above ground carbon stocks
Although soil carbon is the biosphere’s largest carbon reservoir, forests and other vegetation also make up a large part of the total carbon pool. Carbon sequestered and stored in vegetation plays a vital role in climate regulation.

Nectar plant diversity for bees
Mean estimates of nectar plant species for bees
Pollinators and pollination are important for both food production and wild flowers. Crops such as apples and field beans particularly require wild pollinators. Wild flowers make a significant contribution to cultural ecosystem services.
Plant indicators for habitats in good condition
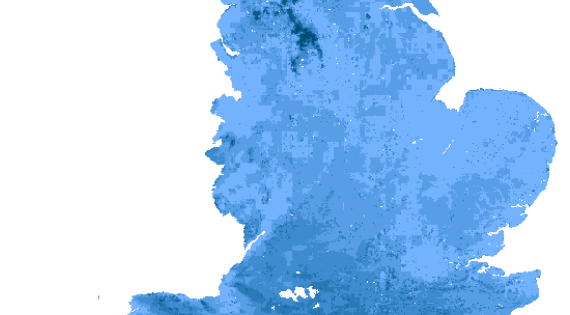
Mean estimates of plant habitat indicators present (%)
Total plant species richness can be deceptive as a measure of biodiversity. Higher species numbers may be an indication of nutrient enrichment or disturbance. This map is based on plant species that are positive indicators, or characteristic species, of a particular habitat. Their presence indicates that a habitat is in good condition.
