Cloud cover, battery life and eagle attacks - all part of drone surveying
Charles George, from UKCEH, reports on his field campaign in January – February 2020, spending the 6 weeks in the high-altitude páramos of Boyacá, Colombia, capturing drone imagery. PARAGUAS is investigating how plants and people are influencing water storage in such areas, the source of water for many in Colombia.
On 6th January I travelled with UKCEH colleague Chris Barry to Boyaca Colombia to undertake six weeks of intensive field work, using a drone to capture high definition imagery of all 12 of the project ‘micro-cuencas’ (i.e. small watersheds or catchments) located across our PARAGUAS study area, the páramo Guantiva-La Rusia. These micro-cuencas’ had been selected in the previous years’ February-March 2019 campaign . On arrival in Tunja (Boyaca), we were joined by Jeffrey Prieto Naranjo and a driver in 4x4 pickup to form a small but effective team of four.
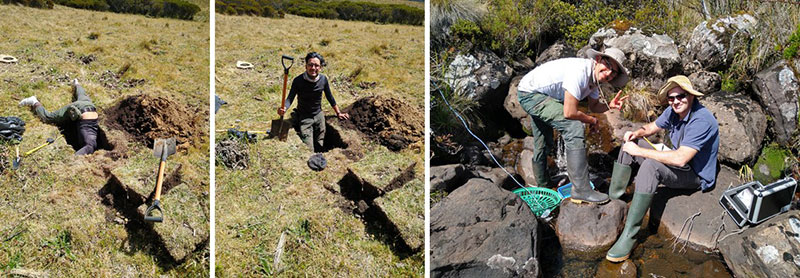
During this trip Chris and Jeffrey, our local field technician, would mainly be digging soil pits and taking soil samples across the catchments, while I would focus on the drone flying. Jeffrey, as well as being our translator, also played a critical role in securing access and permissions to fly the drone and dig for soil samples on the sites. As an add on Jeffrey and Chris would also collect a first set of water samples. Early on in the project they discovered that they were both interested in the impact of land use on water quality and agreed to collaborate on this topic by jointly supervising a student supported through a PARAGUAS field bursary.
The 12 catchments are organised in nearby pairs: one represents a near-as-possible pristine catchment, the other an impacted catchment. The drone campaign would deliver imagery to provide valuable high definition digital surface models (DSM) in support of the hydrological modelling, to estimate plant numbers, types and biomass and to allow direct comparison of catchments in terms of their main vegetation cover composition. The soil samples were collected for analysis at the labs of the University of Tunja, providing data on e.g. soil organic content, soil porosity and bulk density to inform the soil modelling.
The drone campaign will deliver three main data resources
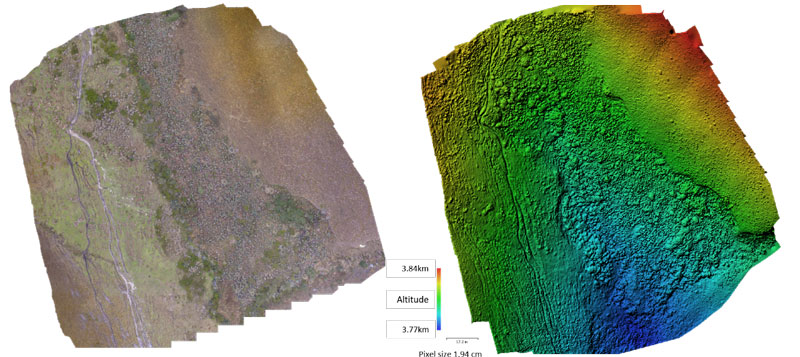
For me, this drone campaign was the start of my work. The drone collected individual photographic images at very high spatial resolution (3 cm) which, when now back in the lab, I am stitching together into a single geo-located DSM of the whole micro-cuenca. This DSM is crucial for the hydrologists in the team to understand and correctly model the flows of surface water through each catchment.
I am also generating an image orthomosaic of the whole catchment from the individual drone images which I will use to classify and map the main vegetation classes.
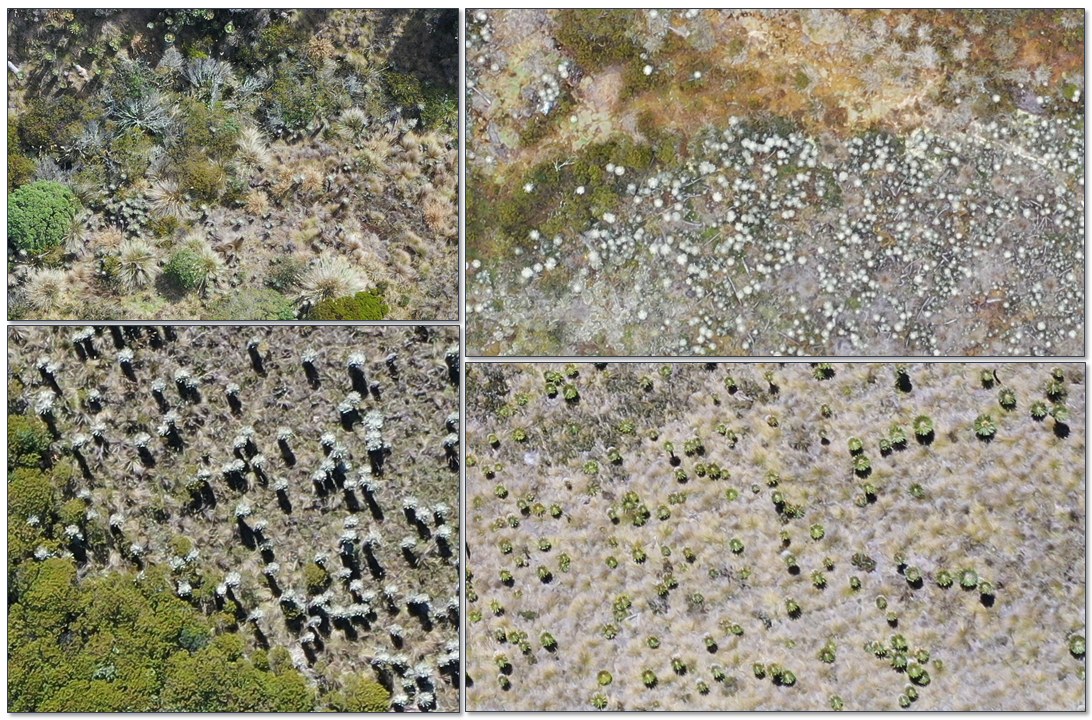
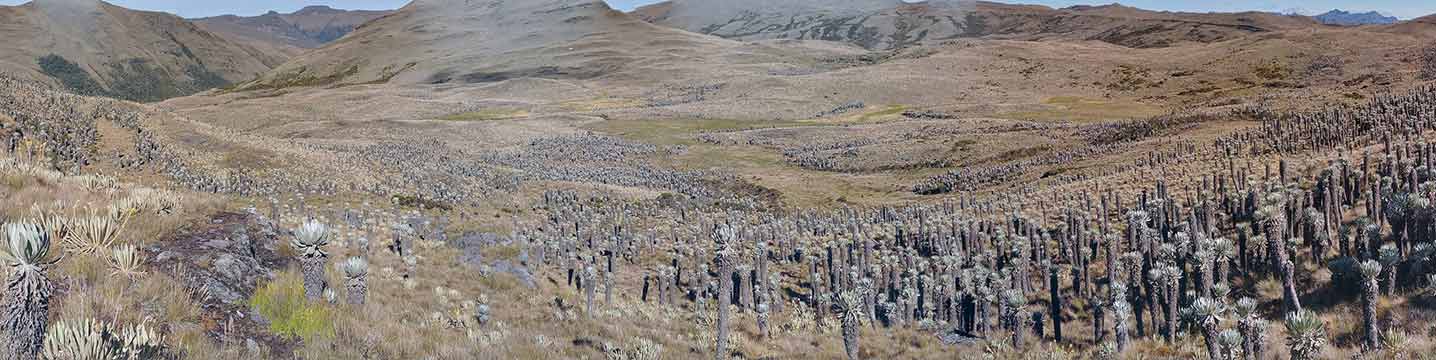
The amazing detail captured by the drone imagery. The rosette shapes that are visible on the imagery are frailejones.
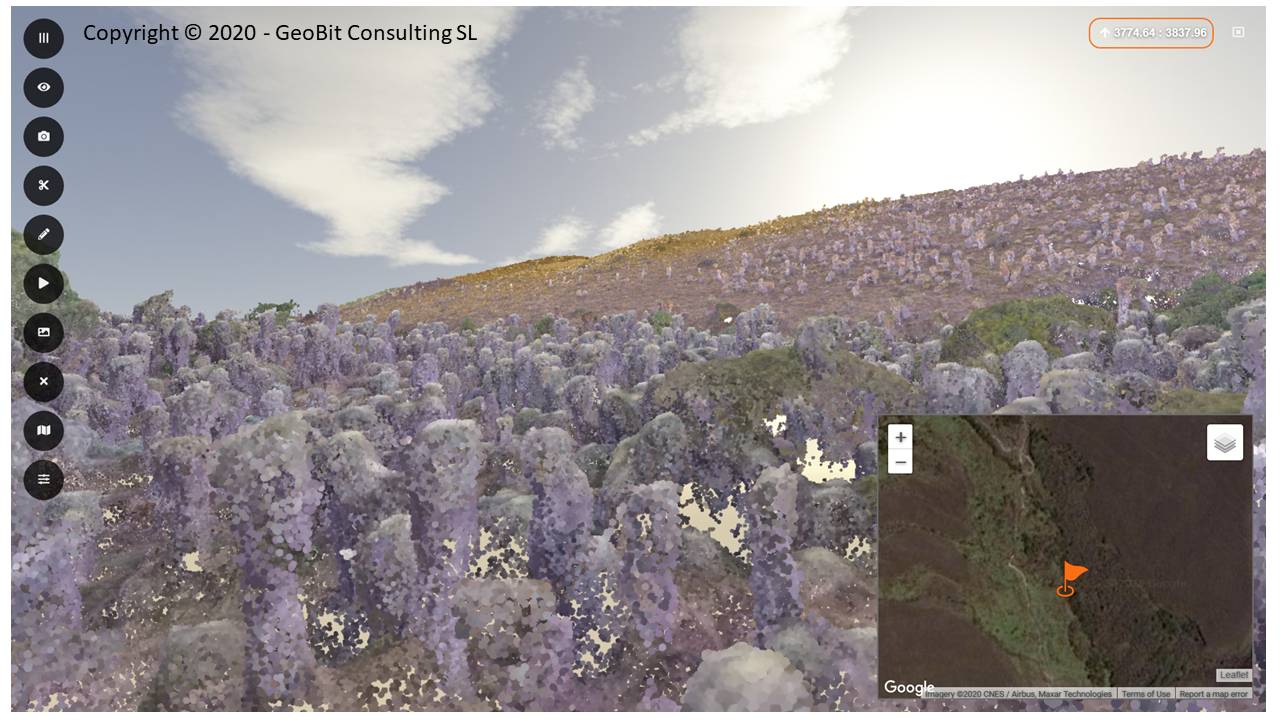
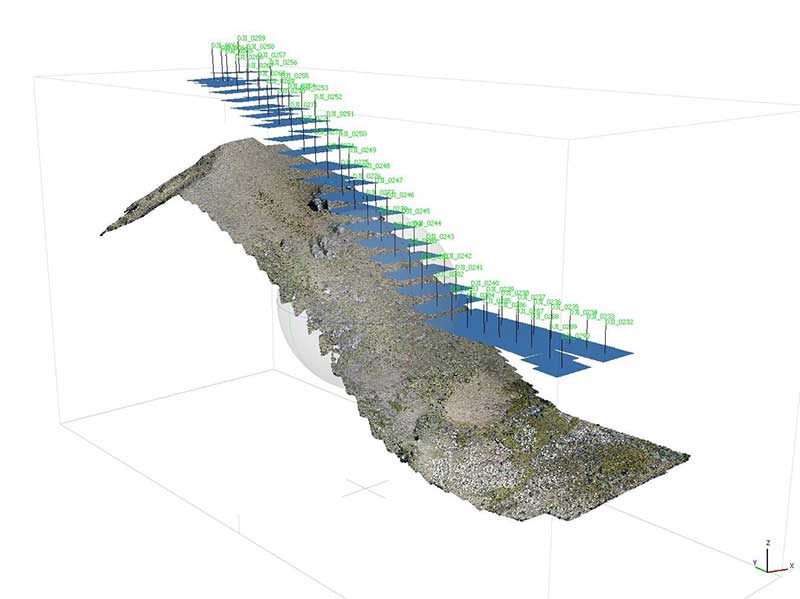
Finally, I am generating 3-dimensional point clouds of the vegetation within each catchment. The plan is to later on in the project relate this data, especially the plant height data, with the allometric and biomass observations collected by the botanical team to produce maps of biomass for the main plant types found within the catchments. At the moment France Gerard (Project PI and remote sensing expert) and I are collaborating with Ce Zhang, expert in Artificial Intelligence (AI) and lecturer at Lancaster University, to develop an AI approach that will map individual plants from the drone derived orthomosaics and point clouds.
In turn, all these derived data will provide valuable information to help evaluate the relationship between vegetation, the soil and the hydrological of our sites and eventually across the whole páramo Guantiva-La Rusia.
In the field
As our study sites are at a height of 3,500 m to 4,000 m, Chris and I were forced to hang out in Tunja (3,000 m) for the first three days of our trip to acclimatise to the altitude. This gave me valuable time for pre-planning and programming the drone flight paths for the 12 catchments we were going to visit in the coming weeks.
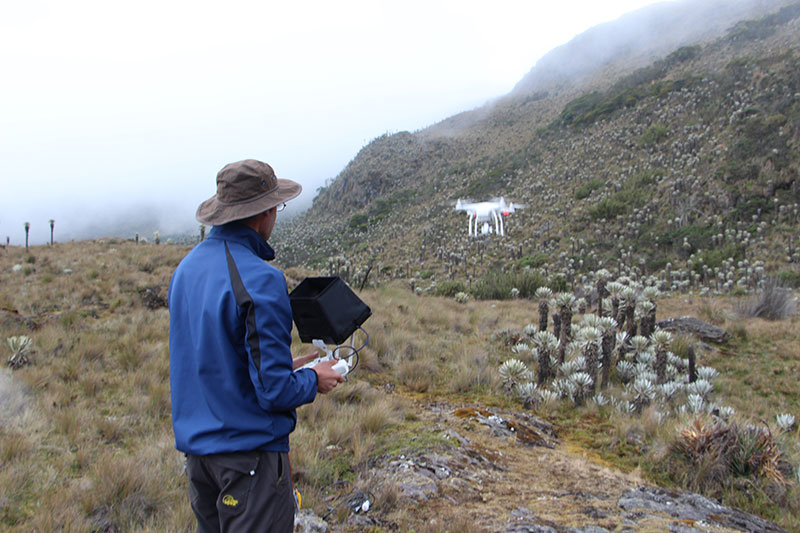
Once in the field our days followed the same routine: the day usually started at 6am –reaching the catchment areas from our accommodation often involved an hour and a half drive followed by an hour of trekking through the páramo, so long days were inevitable. Once in location I was at the mercy of the weather and the clouds. It was not unusual to arrive at a site and having to settle down for hours in the foggy clouds, getting cold and damp, waiting for the sun to break through - the record wait on this trip was five hours! Low clouds or fog don’t just make it impossible to collect decent imagery, any water ingress into the drone could cause a malfunction!
Once in location I was at the mercy of the weather and the clouds!
My original aim was to allow three days to fully survey each catchment (covering on average an area of 1 km2, with the largest covering about 6 km2). However, on average it took me 2 days per catchment - a welcome result as the most troublesome catchment took us five days to survey because of strong winds and the odd hawk and eagle attacking the drone. In total I piloted 151 flights which added up to a total flight time of approximately 45 hours, yielding over 20,000 images and 350gb of data.
I am now back in the UK busy processing the imagery, which I estimate will take about 10 weeks of processing time.
To stitch all the images together I am using a ‘Structure from Motion (SfM)’ software, (in this case from Agisoft). After the initial pre-processing of the data it will then take me approximately three months to classify the drone imagery to map the main types of vegetation with the catchments. The Artificial Intelligence based work is much more experimental and is likely to take more time.
More about the drone technology
For this campaign I was flying a DJI Mavic 2 Pro (a small 4 rotary wing drone), equipped with a Hasselblad 20-megapixel camera with a 1-inch CMOS sensor to provide excellent detailed captures.
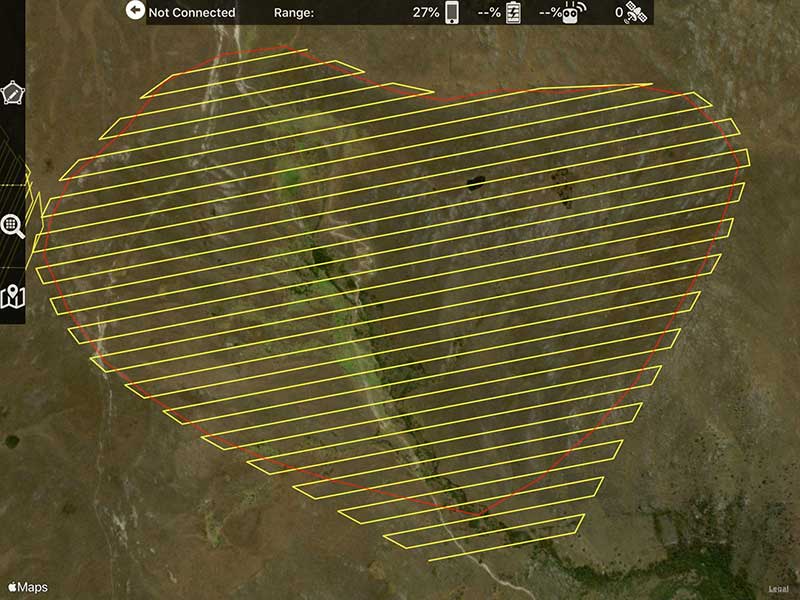
The drone works in conjunction with the Map Pilot (Drones Made Easy) flight control software installed on an iPad that contains the flight plans and a rough digital elevation model. The latter allows the drone to fly at a constant height above ground to give an even pixel size over the whole area (and to prevent the drone flying into the mountain). The flight control software determines flight lines (across a grid based on the flight boundary that defines the survey area - see image below), flight height and speed based on the amount of spatial detail and amount of overlap between individual images (front overlap -80%) and between each straight pass (side overlap – 80%) that I would like to achieve. The degree of overlap determines the degree of 3-dimensional detail.
This flight plan including speed and height are then uploaded to the drone which will, once launched carry out the campaign autonomously. During this campaign I was flying the drone at 120m above the terrain. As the drone pilot, my role is to launch and land the drone safely and to intervene when spotting hazards such as too much wind, clouds or birds of prey.
Power was the most critical part of the campaign. An average battery allows for approximately 20mins of mission time depending upon the wind speed and altitude changes and I had access to only eight batteries in the field. 160 minutes flying would on average cover around 1 km2 area. Getting batteries across from the UK to Colombia was not straightforward due to airline regulations on such matters and, in the end, to keep a long story short, involved several PARAGUAS team members transporting batteries in their hand luggage to help me out.
Charles George. Earth Observation Scientist