Steve Turner, hydrologist at the UK Centre for Ecology & Hydrology, reflects on this year's record-breaking heatwave and long period of dry weather and looks at the status of the UK’s water resources as we move into autumn and winter...
The UK experienced a prolonged period of dry weather in 2022 which culminated in a severe summer heatwave and record-breaking temperatures, posing challenges for water resources as we move into the autumn. Impacts of the protracted dry weather and low river levels included environmental stress in aquatic ecosystems, challenges for farmers in terms of irrigation, harvesting and drilling seeds, stressed terrestrial habitats and severe wildfires.
So, what happened?
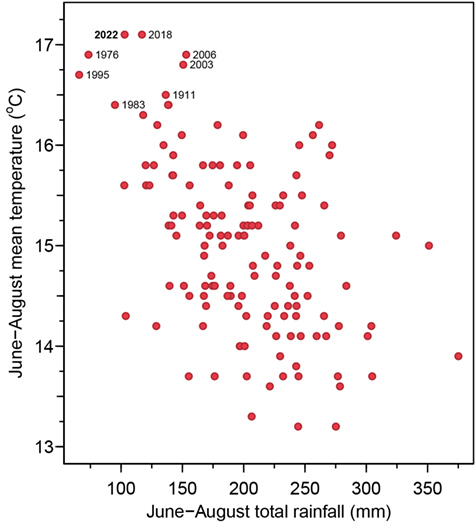
The summer was notably hot, with maximum temperatures far above average across much of England, and new record highs for Wales and Scotland. A new UK record temperature of 40.3°C at Coningsby, Lincolnshire was recorded on 19 July and the season was generally settled with little rain during most of July and August. Summer 2022 (June-August) registered as the fifth driest for England & Wales in a series from 1836. This combination of dry and hot weather meant that June-August in England joined an exclusive club of exceptionally hot and dry summers (eg 1976, 1995, 2018) in a series from 1884 (shown in the plot below).
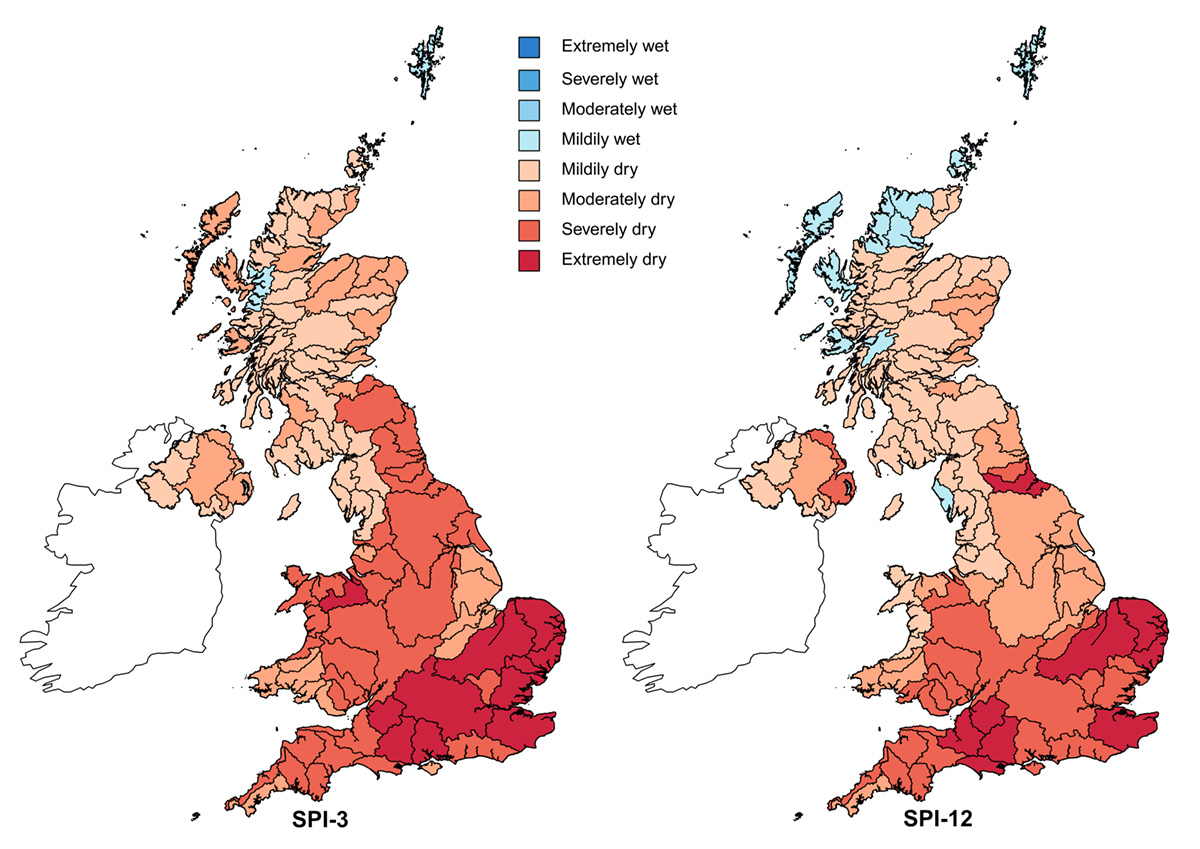
Rainfall for the summer period across the whole of the UK was low, with less than two-thirds recorded compared to the 1991-2020 average. Many regions, particularly in England, received less than half the average rainfall, including Severn Trent, Yorkshire, Anglian, Thames, Wessex and South West. The Anglian, Thames and Wessex regions all recorded their fifth driest summer in records since 1836. Rainfall deficits can also be compared using the Standardised Precipitation Index (SPI), a widely-used drought index. The map below shows the rainfall deficits over the three-month period ending in August (SPI-3) during which the majority of England, Wales and south-east Scotland were in the ‘severely dry’ and ‘extremely dry’ categories. Taking a longer view, the SPI-12 period (September 2021-August 2022) also highlights the severe duration and magnitude of the event.
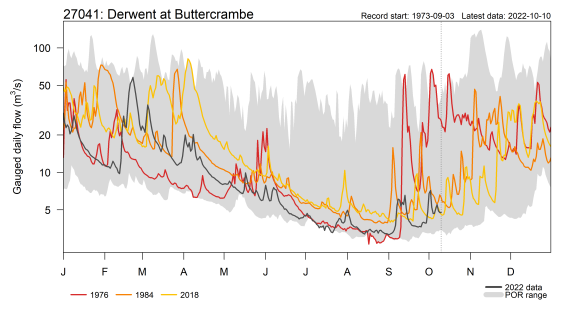
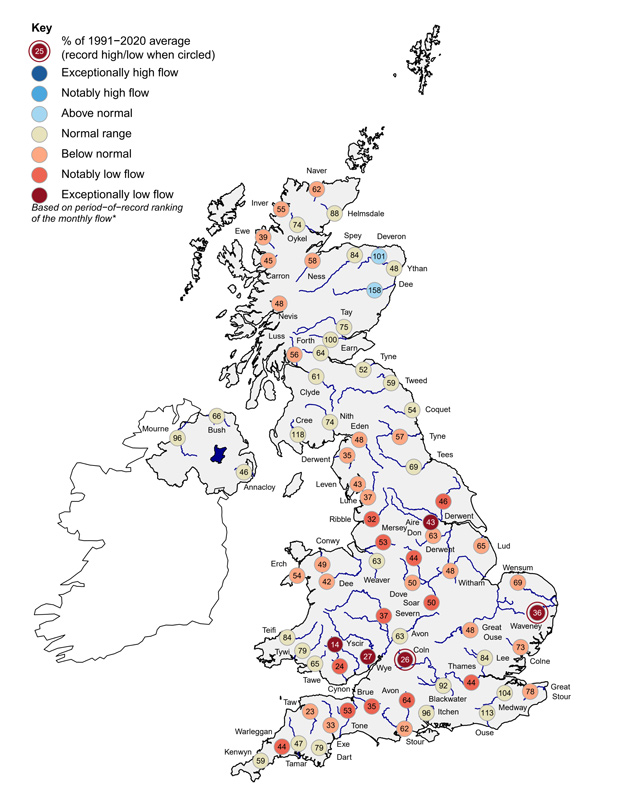
By the end of summer, daily river flows were among the lowest ever recorded for some catchments in southern and eastern England, rivalling and sometimes eclipsing those of droughts in 2018, 1995 and 1976. As of 31 August, 51 per cent of the 836 gauging stations on our UK Water Resources Portal were in the notably or exceptionally low category. Summer river flows across the UK were notably to exceptionally low across much of England, southern Scotland and south Wales. There were new record summer minima recorded on the Yscir, Waveney and Yorkshire Derwent, which all have records of 48 years or more.
Using the most recent river flow data up to the end of September we have assessed the severity of these low flows on a few selected rivers. The table below shows the ranking of various low flow minima for different periods of time. For example, the 7-day minima refers to the lowest 7-day average river flow of all such periods within a year.
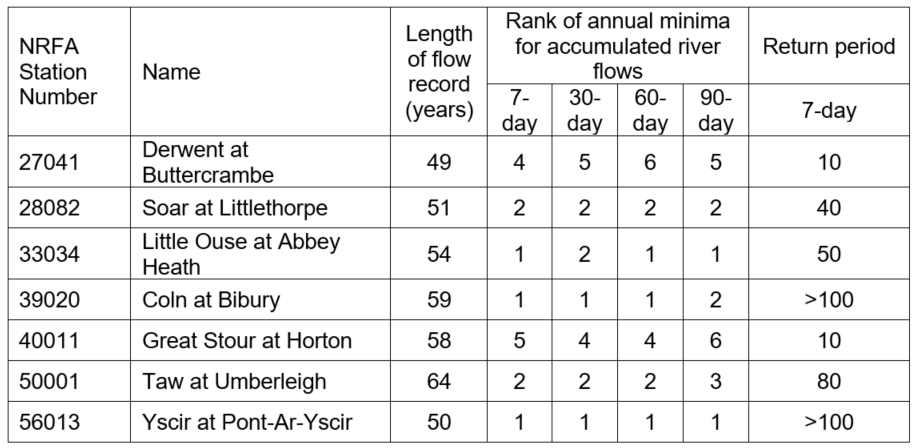
The table also provides the return periods for 7-day minima using the Wallingford HydroSolutions Hydro Tools package (with default options set). Note these minima were estimated using time series extending up to the end of September 2022 but, in some catchments, flows were still decreasing, so it's possible that the ranks may change. These are provisional early assessments and will be updated later when full time series are available.
The analysis shows the 7-day minima at these sites were all in the lowest five years on record, and the lowest on record in both responsive rivers (eg Yscir, south Wales), as well as less responsive rivers (eg Coln, Gloucestershire). It’s interesting that these rankings don’t change a great deal when looking at the longer 30- to 90-day minima, which highlights the severe nature of the extent and duration of this year’s drought. Further analysis suggests that 2022’s 7-day minima at some sites have a return period of around 50 to over 100 years. This equates to around a two per cent chance of happening in any given year (eg on the Little Ouse and Taw) and around a one per cent chance of happening in any given year for the Coln and Yscir.
Groundwater levels also continued to fall during August and ended the month mostly below normal to exceptionally low. Levels were exceptionally low in the Chalk of southern England and in the Carboniferous limestone of south Wales, where the borehole at Pant y Lladron saw its third successive month of record low levels (in a series of 27 years).
At the end of July, soil moisture data from UKCEH’s COSMOS-UK network showed that soils were generally dry across the UK, and exceptionally dry in southern England following the heatwave conditions. By the end of August many soils further north and west also became notably dry for the time of year. Due to the large soil moisture deficits even sites which received rain during the month experienced only a short-lived increase in soil moisture before drying again.
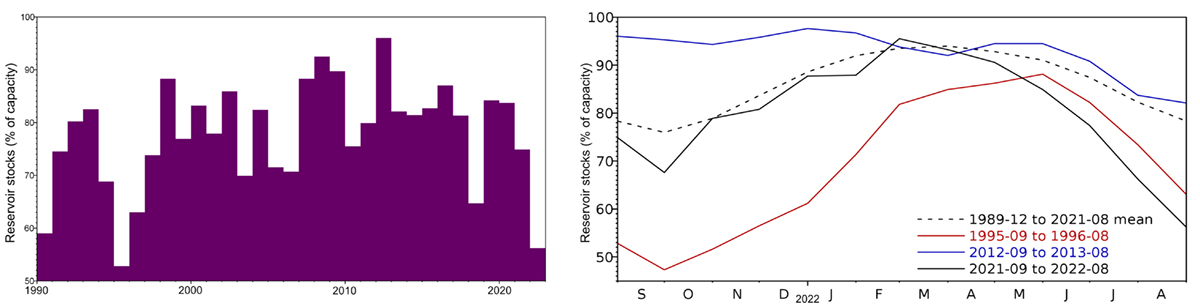
The rainfall deficit and increased water demand spurred on by hot weather meant by the end of August reservoir stocks in southern England were exceptionally low - around 40% below average at Colliford, Cornwall and Ardingly, West Sussex. The end of August reservoir stocks for England & Wales (shown in the plot below) were the second lowest on record (since 1990) after the 1995 drought which particularly affected northern England – an area where reservoirs are more common. The low status of water resources has led to Temporary Use Bans (previously known as hosepipe bans) being implemented by eight water companies in England and Wales. Eleven of the Environment Agency’s 14 operational areas are now in official drought status. At the start of September, drought status was also extended to all areas by Natural Resources Wales.
What has happened since summer?
At the start of September, we saw unsettled conditions with showery and occasionally very wet weather, particularly in northern and western areas of the UK, but also in southern England. Low pressure systems moved in from the Atlantic bringing, at times, some notable rainfall totals eg 63mm at Tiree (Inner Hebrides) on the 2nd September, 41mm at Plymouth (Devon) on the 3rd, 58mm at Garnswllt Sewage Works (Dyfed) on the 4th and 76mm at Balmoral (Aberdeenshire) on the 5th.
The unsettled conditions inevitably led to increases in river flows during the first 10 days of the month, and daily river flows were in some cases exceptionally high (left below) in northern Britain and south-east England.
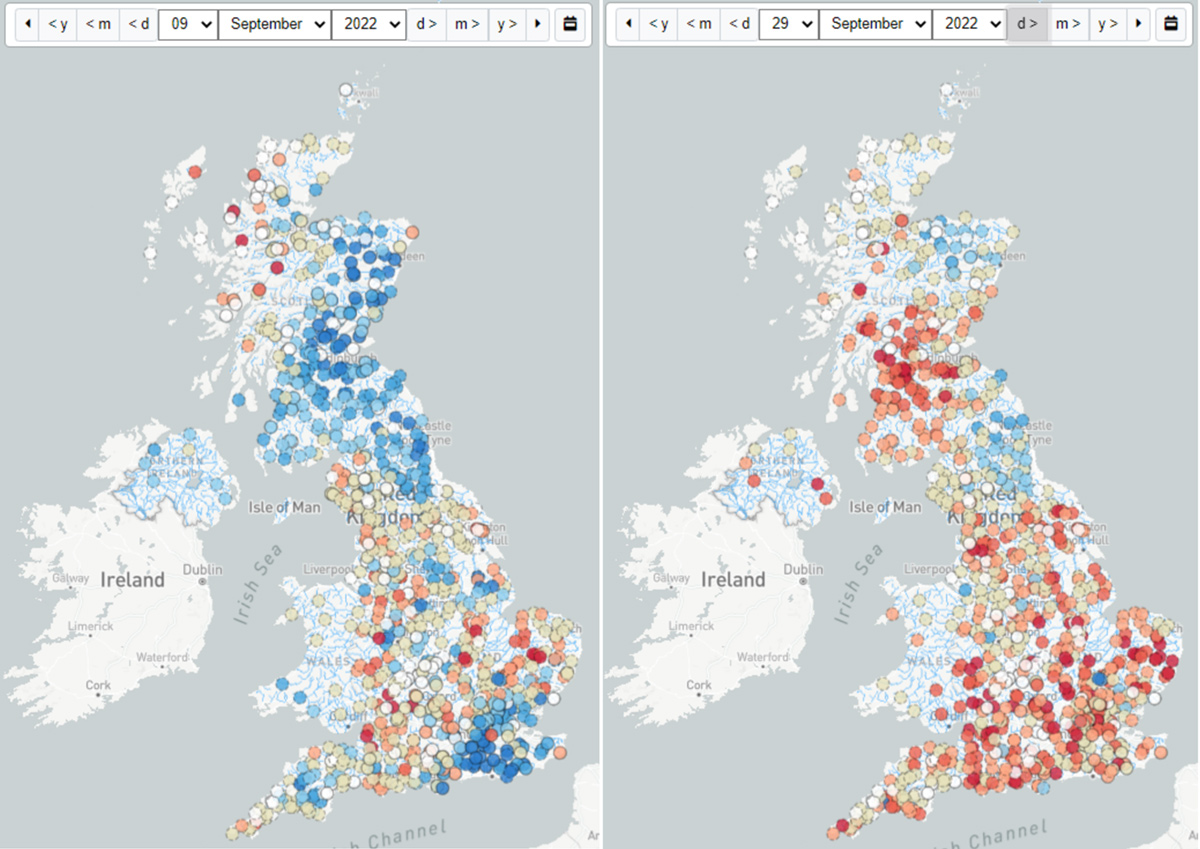
The last two thirds of September generally saw a return to more settled conditions with more modest rainfall totals, and the increase in river flows at the start of the month was short-lived, with flows returning to notably and exceptionally low across the country by the 29th (above right). However, on 30 September frontal rain swept across the UK, heaviest in the north and west, and 100mm of rain fell at Seathwaite and 94mm at Honister (both Cumbria). Flash flooding in the Lake District resulted in transport disruption and loss of livestock.
For September as a whole, rainfall for the UK was above average (111 per cent of 1991-2020 average), the first month of above average rainfall since May. Despite this, some regions still recorded less rainfall than average, including the Anglian and Highland regions which saw less than 85 per cent, compounding the effects of the previous dry months.
Despite the rain, September monthly river flows remained low; the majority of sites were below normal across most of England and Wales. Record low September flows were recorded on the Waveney and the Coln, while many rivers in England and Wales registered less than a third of the September average. Further north in Scotland and Northern Ireland, September average monthly river flows were in the normal range.
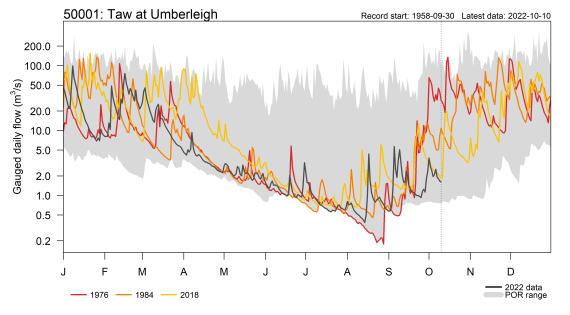
River flows have generally been somewhere in between the 2018 and 1976 droughts for most of the year. For much of spring 2022, flows in catchments across England and Wales remained higher than those in 1976. During the summer, in some catchments such as the Derwent, the 1976 (red line in the plots below) and 2022 (black line) flows tussled for the lowest. In the south-west, 2022 flows on the Taw were among the lowest during spring and summer, but, responding to recent rainfall in September, they increased, departing from similar drought years. However, there was a remarkable transformation for both these catchments in 1976 and river flows in the autumn of that year increased sharply in response to very wet weather, as signified by the steepness of the red lines in the graphs below. This was in common with many catchments in the country – the autumn of 1976 was exceptionally wet, and the drought recovery was abrupt (more details in our 1976 drought report).