This year marks the 60th anniversary of measuring local weather conditions at the UK Centre for Ecology & Hydrology’s meteorological site in Wallingford, Oxfordshire. The site recorded its highest temperature during the recent heatwave. Hydrologist Steve Turner explains the role of the station.
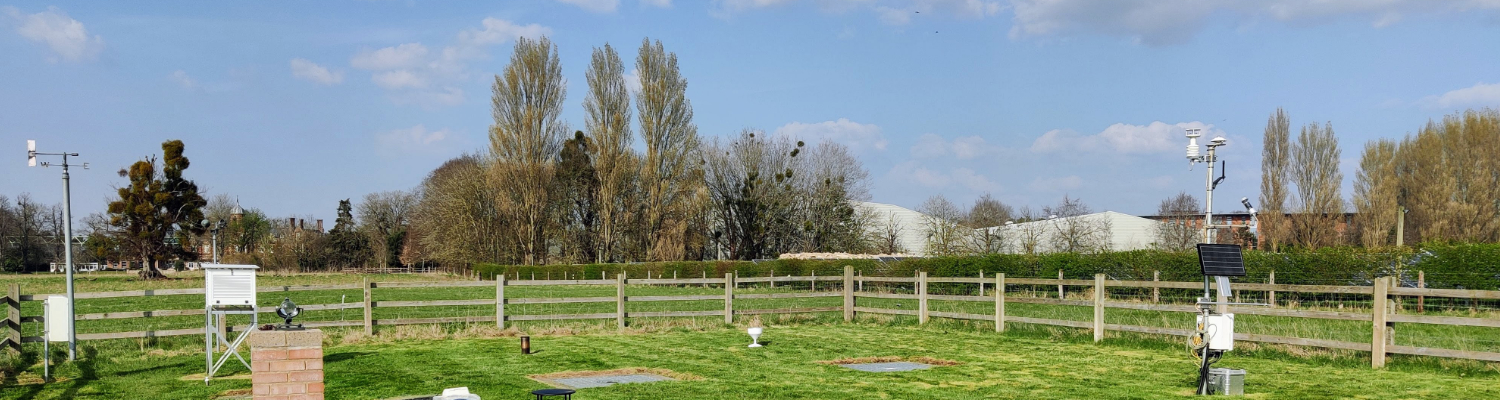
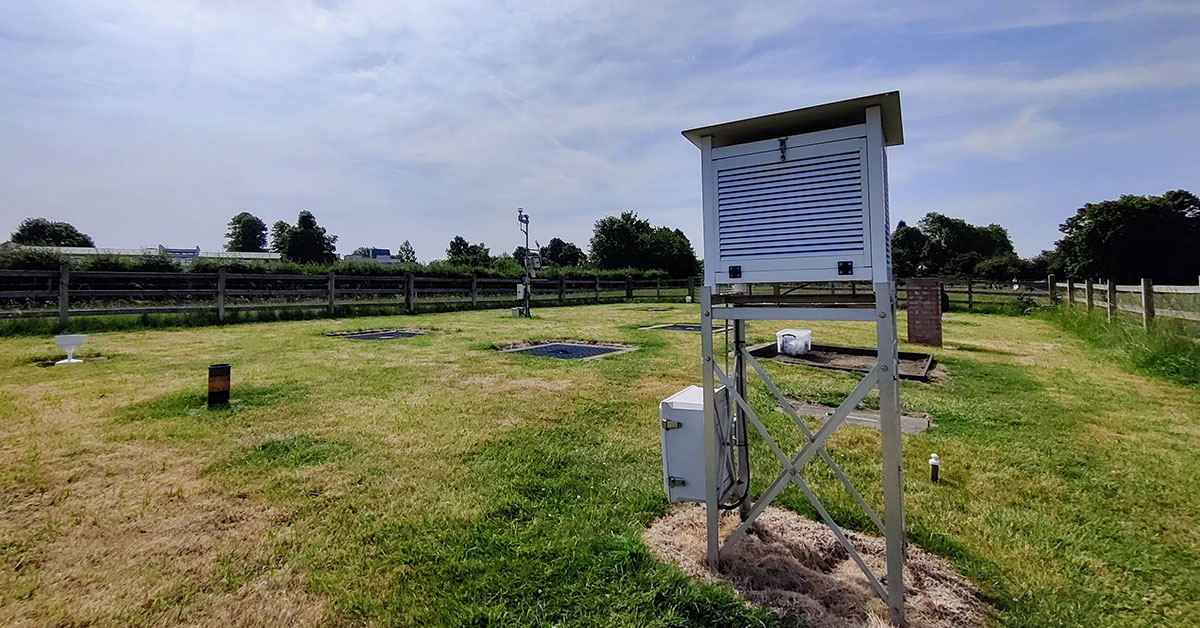
The meteorological station at our Wallingford site has now been measuring daily rainfall, sunshine and temperature parameters since 1962 when the Hydrological Research Unit, which later became the Institute of Hydrology, was established here.
The station monitors local weather conditions on a daily basis and data are submitted to the Met Office as it forms part of the UK Climatological Observation Network. The site is also used to support instrumentation calibration and other scientific projects. Such long-term observations help develop an understanding of hydrological and meteorological systems and show trends over time which could be linked to climate change.
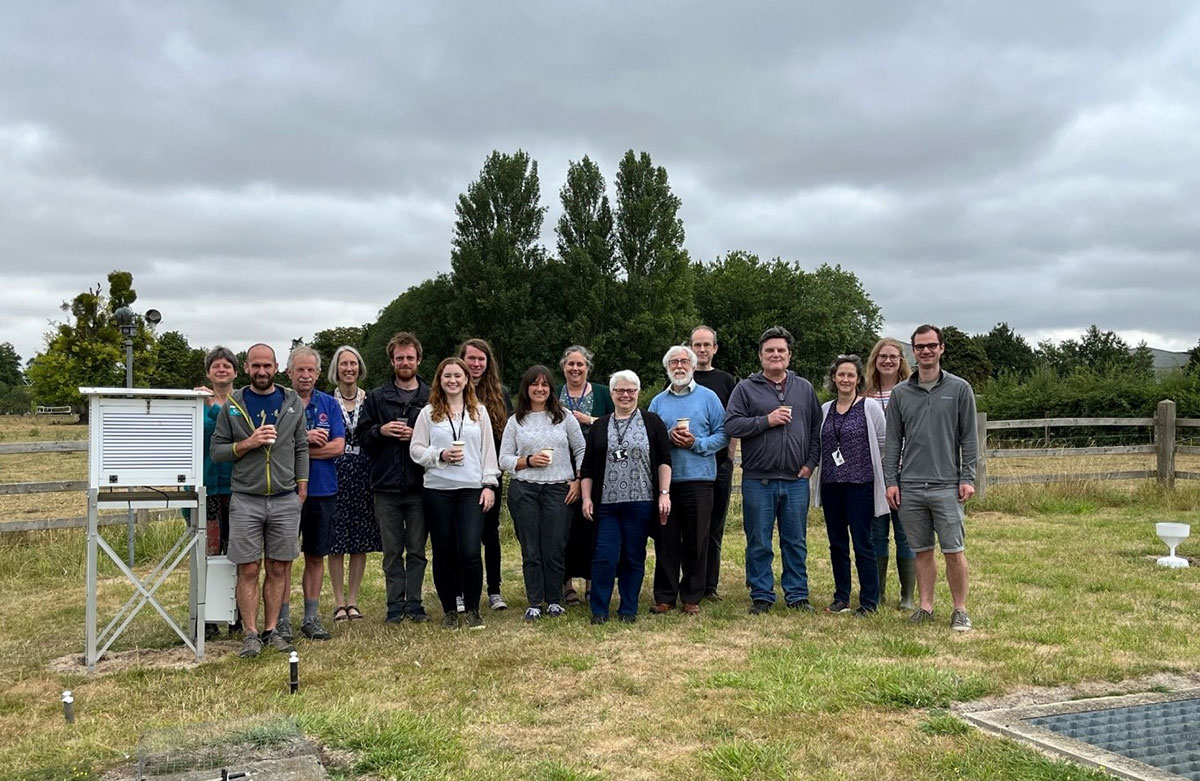
This week (26 July 2022) a number of current and past observers gathered out on the site for some cake and the opportunity to share tales of their recording experiences. These included 9am readings at -9°C, close encounters with cows (the Met Site compound is in a cattle field next to the River Thames), anxious times watching rising river levels during winter, tireless attempts to find ground thermometers in snow and enjoying being out in the sunshine while doing ‘essential maintenance’!
Over the years a huge volume of meteorological data have been recorded. The table below shows some of the extremes measured in the past six decades:
| Warmest day | 19/7/2022 | 38°C |
| Coldest night | 14/1/1982 | -21°C |
| Wettest month | August 1977 | 163.6mm |
| Driest month | May 2020 | 0.8mm |
| 'Sunniest' month | May 2020 | 334.3 hours |
| 'Cloudiest' month | December 2010 | 12.7 hours |
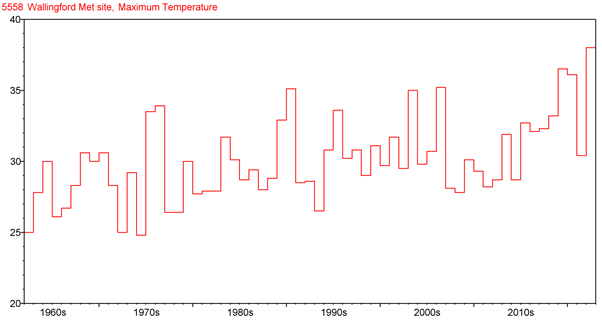
July appears to be the warmest month here in Wallingford with our top five temperatures all being in July, and all since 2006. The temperature recorded just last week on 19 July 2022 of 38°C eclipsed the previous record of 36.5°C that was recorded in July 2019.
| Date | Temperature (°C) |
| 19/7/2022 | 38.0 |
| 25/7/2019 | 36.5 |
| 31/7/2020 | 36.1 |
| 18/7/2022 | 35.5 |
| 19/7/2006 | 35.1 |
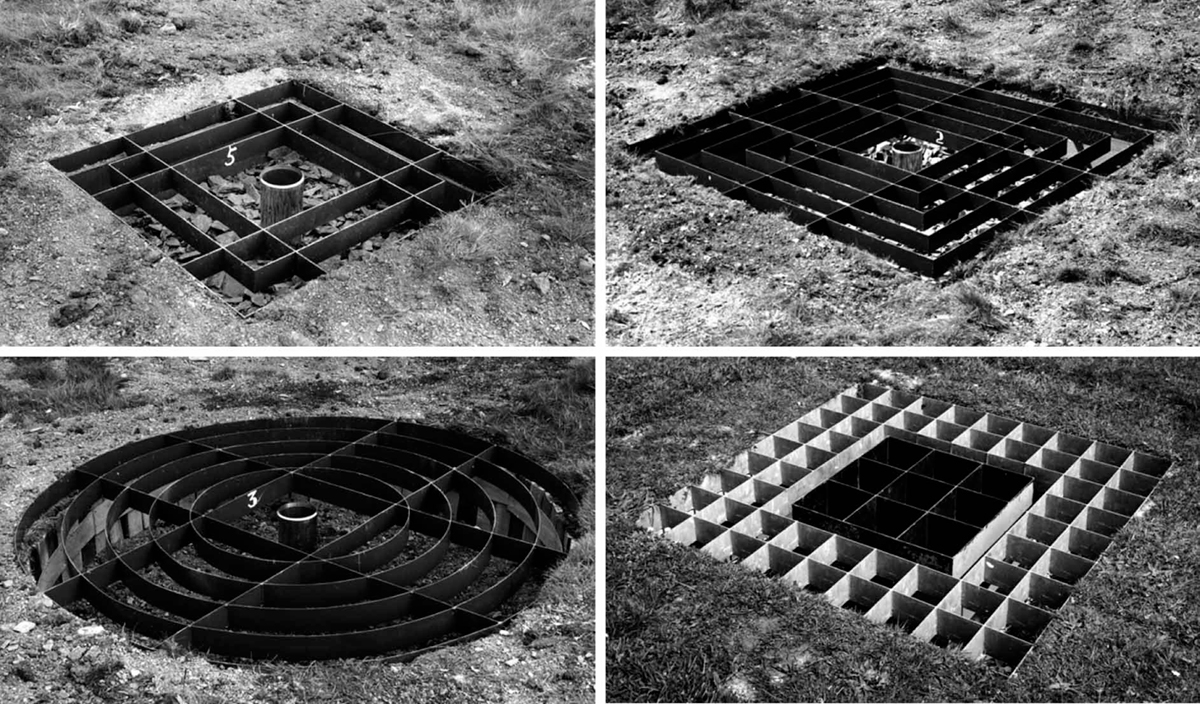
As well as the daily observations, the site has been used for various trials and experiments over time, relating to different areas of meteorology, for example rainfall. Accurate measurements of rainfall data are vital for many aspects of hydrology, and the siting of rain gauges can affect the measurements. At Wallingford, studies into how the height of rain gauges might affect the amount of rain they collect have been going on for many years.
The picture below shows an experiment of different designs of mounting rain gauges at ground level and how this might affect how much rain is captured.
Most recently due to an increased use of weighing rain gauges around the UK, we carried out a study to determine how much rainfall is collected at gauges mounted at three different heights between ground level and one metre, and whether this change of instrumentation causes issues with the consistency of long-term rainfall records. The results show that there is a potential for recording at least nine per cent less rainfall in a gauge mounted at one metre, compared to a gauge mounted at ground level. This research has helped to build an evidence base that the environmental regulators in the UK have used to inform when upgrading their own meteorological networks with new types of rain gauge.
Being a manual climate station means that 365 days a year, including Christmas Day, one of our observers will visit the Met Site at 09:00 GMT to take the readings. I would like to extend my gratitude and thanks to all those involved in the Wallingford Met Site over the years for helping to maintain and gather this important data that feeds into the national meteorological dataset.
Our daily observations data from the last six months are available on our website. The last five days of data from our automatic weather station, which measures meteorological variables every 15 minutes, are also available to view on the website. Full historic data can also be requested from Steve Turner.
Steve Turner