Following the wettest February on record, spring 2020 was the sunniest on record and exceptionally dry across much of the country. Low soil moisture and river flows have resulted in impacts on agriculture and the environment, and heightened concerns over water resources. Here we continue our blog post series, helping to put the hydrological situation in a long-term context and consider what may happen next.
What happened over the spring and was it exceptional?
Rainfall
For May, rainfall was just under half of average for the UK as a whole. However, large parts of the country recorded less than 15% of average making it the driest May for England & Wales in a series from 1910 The persistence of dry conditions over the spring (March-May) resulted in equally outstanding figures - it was the fourth driest spring for the UK and the driest spring on record in many regions of England and Wales (also in a series from 1910).
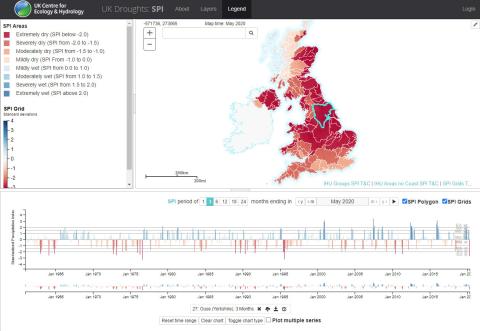
Exploring the data on UKCEH’s Drought Portal, it is clear that we experienced a significant meteorological drought at the UK scale for the spring. The Standardised Precipitation Index (SPI) for that three month period (SPI-3) shows that much of the UK is categorised as ‘Extremely dry’ with many parts recording the lowest SPI-3 since the notable drought of 1995. While longer time periods are influenced by the exceptionally wet February, in the north-east of England and Scotland, exceptionally dry conditions can be traced back to the start of the winter - some areas here have recorded the lowest six-month SPI (SPI-6) since 1973.
We can get a much longer view of the severity of these rainfall deficits by using the England & Wales Precipitation (EWP) series from the Climatic Research Unit (CRU) that extends back to 1766. In this series, the one month SPI (SPI-1) for May 2020 was the second driest in the series after 1844 and when looking at the entire series, it appears just inside the driest 20 months (out of 3053 months). Spring 2020 as a whole was the twelfth driest spring in the 254-year series (using the SPI-3).

Above: UK Drought Portal showing the SPI-3 drought index ending in May 2020 for the UK, with the Ouse highlighted and shown on the graph at the bottom.
Soil moisture
UKCEH’s COSMOS-UK network, which started in 2013, now monitors soil moisture at about 50 sites across the UK. These relatively short records don’t allow us to present the same type of analyses or comparison with past events that can be made with rainfall and river flow data. However, we can clearly see the remarkable transition in soil moisture since the winter.
Following the last two months of predominantly dry and sunny weather, the water content in soils fell rapidly from the saturated soil conditions seen at the end of winter. By the end of May, soils were notably or exceptionally dry and already at similar soil moisture levels to those observed in late July 2018. These conditions are also seen using the MORECS soil moisture product from the Met Office, which provides a longer-term view – for the UK, end of May soils were the driest on record (in a record from 1961).
In some places, the available soil water was nearly exhausted in late May and across the country caused grass to turn brown and there were impacts on some crop yields. The dry ground and vegetation also significantly increased the risk of wildfire, with numerous instances across the UK in May (e.g. in Dorset, northern England, Wales and Northern Ireland).
Above: Soil moisture status for 29 February 2020 and 31 May 2020 from the COSMOS-UK network.

Above: Browning grass in the Hambleden Valley, Buckinghamshire, taken 4 June 2020. Photo © David Boorman.
River flows
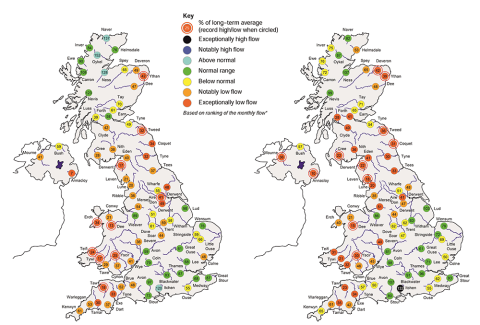
Following widespread flooding in February and early March, flows in most rivers declined sharply through April and May and by month-end were the lowest recorded for the time of year in some catchments in northern and western Britain. For May as a whole, river flows were notably or exceptionally low in a band from Cornwall to north-east Scotland and the lowest on record in a number of rivers (in record of more than 35 years).
Averaging the river flows for both April and May shows a similar picture, with new record low flows registered in many catchments. For the Severn, Welsh Dee and Scottish Dee, where we have records extending back to the 1930s (and 1921 on the Severn), April-May flows were the fifth lowest in the series.
Low river flows in responsive catchments across western England and Wales have seen river beds dry up, with associated environmental impacts (e.g. fish rescues were required on the River Teme in Shropshire).

Above: River flow averages for May 2020 (left) and April-May 2020 (right).
When we are in, or approaching, drought conditions such as those the end of May1, we often think back to the benchmark drought of 1976. However, 2020 has been quite different as a result of the wet winter which boosted groundwater supplies, compared to the winter of 1975/1976 which was very dry with rainfall deficits over a much longer period, meaning that groundwater stores were not replenished.
The situation at the end of May was more akin to the short duration spring/summer drought of 1984, a notable event in the north and west. There are also similarities to 2010, which saw exceptional flooding in the previous winter (November 2009) followed by a spring drought, particularly affecting river flows and water supplies in the north and west of the UK where there is limited groundwater storage and rivers and reservoirs respond rapidly to deficits. A more recent comparison can be made to the summer of 2018, with very warm and dry weather leading to low river flows in northern and western areas and some localised water resources pressures.
Comparisons such as these can be seen with the 2020 flows shown against previous low flow events. For the Teifi (south-west Wales), the flows in May 2020 are the lowest on record for the time of year (in a 62-year record). For more slowly responding groundwater-fed catchments, river flows have been less impacted in 2020 as a result of the wet winter and healthy recharge season. This can be seen in the plot below for the Coln, where flows were considerably higher than those in years with the lowest May flows.

Above: Hydrographs comparing the 2020 river flow data with the five years from the historical record with the lowest May daily flows. Top: the Teifi (south-west Wales). Bottom: the groundwater-fed Coln (Cotswolds).
Reservoir stocks
Reservoir stocks fell substantially during May, and by month-end were below average at most impoundments and as much as 15-20% lower than expected for the time of year in several. For some reservoirs in northern England, Wales and Scotland, the end of May stocks were the lowest on record in a series from 1988.
Although no Temporary Use Bans (or ‘hosepipe bans’) have yet been in force, the warm and dry weather combined with Covid-19 lockdown significantly increased demand and resulted in the roll-out of ‘Use Water Wisely’ campaigns. Several water companies pumped water into the system to meet the increased demand. Over the coming months, water companies across the UK will manage their resources and operations (in line with their drought plans or equivalent) if dry weather progresses.

Above: Low water levels in Haweswater (Cumbria), taken 3 June 2020. Photo © Katie Muchan.
What is the current situation?
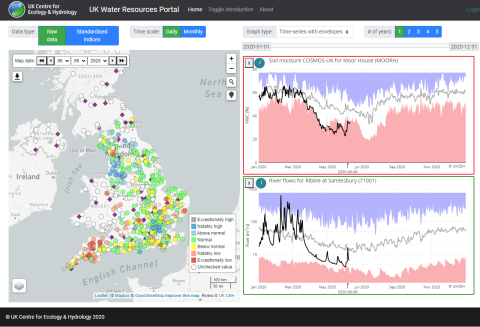
Although there has been some rainfall in the last week, so far this has only provided modest, short-term relief to the situation using data displayed on the UK Water Resources Portal, which provides monitoring of the current hydrological situation in near-real-time for soil moisture and river flows (in England). In some catchments in the north and west which were exceptionally low at the end of May, above normal flows were registered on 6 June following rainfall on the 5th/6th, but flows have since returned to normal and even below in some rivers.

Above: River flow situation in England on 6 June 2020 (map left) and a selected river flow record and COSMOS-UK site (graphs on the right) taken from the UK Water Resources Portal.
What is the outlook?
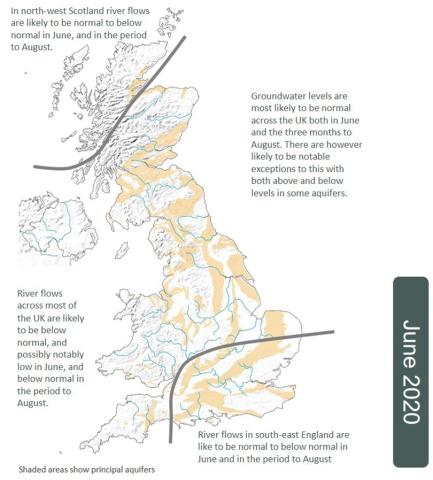
The current weather situation is unsettled, with heavy rain in some areas, which is forecast to continue in the short term. The recently published Hydrological Outlook (below) provides a longer-term view and forecasts our hydrological prospects for June as a whole and the summer (June-August). In northern and western parts of the UK, the one month forecast suggested below normal river flows persisting in June (with notably low flows possible in some catchments) and three months. In parts of the Midlands and south-east England, flows are likely to be normal or below, with above normal flows restricted to groundwater-fed catchments.
There is uncertainty in seasonal-scale hydrological forecasts, particularly in the summer when there is less predictability in the seasonal weather conditions compared to the winter. Moreover, the situation at any time of year can change rapidly in the highly responsive rivers of the north and west (as in summer 2010 and 2018). However, if the projections favouring lower flows are realised we will see continuing environmental stress through the summer, and the prospect of further water restrictions and other socio-economic impacts.
While there is inherent uncertainty in the forecasts, what we can say with certainty is that given the hydrological situation, significantly above average rainfall is needed to replenish river flows and reservoir levels in the north and west especially.

Where can I get more information?
The Hydrological Summary for May 2020 will be published later today, providing further information on the current hydrological situation.
For regular updates on the soil moisture situation, COSMOS-UK data are updated in near real-time.
For near-real-time monitoring of the current hydrological situation including rainfall, river flows, soil moisture and groundwater levels, take a look at the UK Water Resources Portal.
With contributions from Lucy Barker, David Boorman, Jamie Hannaford, Bronwyn Matthews, Simon Parry, Cath Sefton and Stephen Turner.
This blog is published by the National Hydrological Monitoring Programme (NHMP) team, in collaboration with the Environment Agency, Natural Resources Wales, the Scottish Environment Protection Agency and the Department for Infrastructure – Rivers (Northern Ireland). We wish to thank these Measuring Authorities for their hard work in continued monitoring of the ongoing hydrological situation.
1While over the spring we have seen the impact of prolonged dry weather, a drought has yet to be declared by any UK environmental regulator, and would be done in relation to the area of concern. Read the latest position for England.