It is widely accepted that we are experiencing climate change. Though it is challenging to predict its future impacts, we expect to see changes to weather patterns and the frequency of extreme events, melting sea ice, and rising sea levels, all of which pose a threat to human society and ecosystems.
When discussing climate change, much attention is paid to the higher air temperatures that we are experiencing. For instance the five warmest years in the measured UK air temperature record (since 1910) occur post-2000, while 2010-2019 was the second warmest decade, slightly behind the 2000s. What is often overlooked is the associated increase in surface water temperatures in freshwater systems, such as rivers and lakes. In this blog post, we use data collected from a long-term monitoring scheme in the English Lake District to investigate variation in lake temperature from 1945 to 2018.
Long-term data collection and analysis
In the UK we benefit from the availability of multiple sources of long-term environmental data such as rainfall and river flows. In addition, UKCEH has been monitoring the biological, chemical and physical properties of four Cumbrian Lakes since 1945. Initiated by the Freshwater Biological Association (FBA), and continued by UKCEH and its predecessors from 1989, this scheme has delivered more than 400 years of lake data, making it the world’s largest long-term lake monitoring programme. This long-term collection of high quality data can be used to assess trends and variability, enabling us to study the impact of climate change within these fragile systems. Without it, the status of our lakes — which provide vital services to society such as water supply, flood regulation and tourism — would be unknown.
Data are analysed and presented for four lake basins – Esthwaite Water, Blelham Tarn and Windermere (North basin and South basin). Due to variability in sampling frequencies over the 1945-2018 period, we first aggregated the temperature data as monthly averages, and then averaged these monthly values to an annual average. The deviation of annual mean temperature from the 1981-2010 mean (baseline period) is presented below. This is an established method and baseline used for environmental studies that allows long-term trends to be clearly identified.


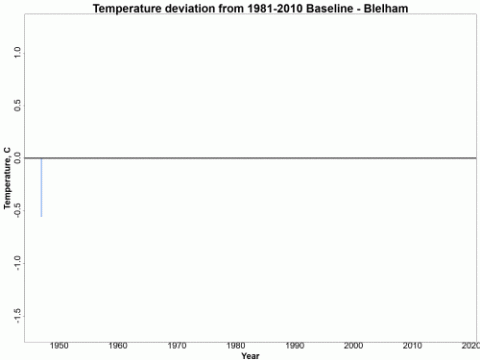
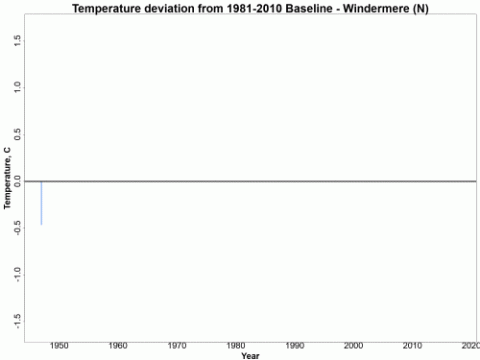
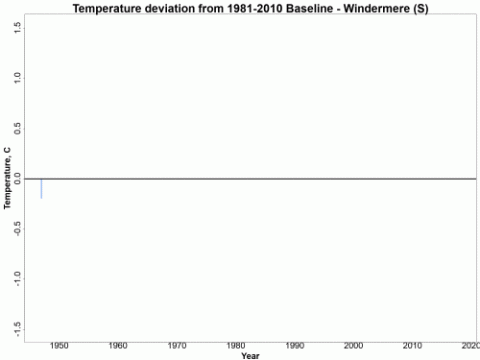
Graphs: Differences in annual average temperature relative to 1981-2010 baseline (given in brackets) for Blelham Tarn (11.07ºC), Esthwaite (11.04ºC), Windermere North Basin (10.94ºC) and Windermere South Basin (11.11ºC).
Across all four lakes, despite their different locations and sizes, there is a clear long-term change from temperatures predominantly lower than the baseline pre-2000, to predominantly higher than the baseline post-2000. This pattern in water temperatures reflects recent analysis published by the Met Office showing that in the decade of 2010-2019 eight new high temperature records were set across a variety of seasons. Similarly to the air temperature records, in all four lakes, at least four of the five warmest years have occurred since 2000. In both basins of Windermere, all five have occurred since 2000 and two of those are since 2014.
"...in all four lakes, at least four of the five warmest years have occurred since 2000."
Lake |
Coldest year |
Warmest year |
| Blelham Tarn | 1963 | 2014 |
| Esthwaite Water | 1965 | 2014 |
| Windermere (North) | 1962 | 2005 |
| Windermere (South) | 1962 | 2005 |
Importance of water temperature
While these higher-than-average surface water temperatures are not readily noticeable to people day-to-day, they are critically important for the life that exists in these fragile ecosystems. For example, higher surface water temperatures can promote potentially harmful algal blooms. Such blooms can impact upon water users, cause fish kills and potentially result in dog deaths. Anyone can increase our knowledge of where and when these bloom events occur, by reporting them using the Bloomin’ Algae App.
Furthermore, increases in lake surface water temperature and its link to the warming of the whole lake can affect wildlife in other ways, by restricting the habitats of cool-water fish species, and altering the timing of seasonal events.
Though, for freshwater wildlife, much of the action plays out hidden from view, we should not feel disconnected from these freshwater ecosystems. We depend on them for many essential ecosystem services including water supply, flood protection, and leisure and tourism. More than ever, it is important to continue to monitor and report upon the way our freshwaters are changing.
UKCEH carries out long-term monitoring in the Cumbrian Lakes as part of the UK-SCAPE national capability programme.
Written by Elena Downes*, Katie Muchan, Ellie Mackay and Steve Thackeray
Further links
* Elena Downes, a Lancaster University MSci student, worked with the UK Centre for Ecology & Hydrology Lake Ecosystems group during a placement in autumn 2019.