The UKCEH Land Cover® plus: Crops map (LCM+) was validated using data collated by the Rural Payments Agency (RPA) and supplied under license for validation purposes. Crops collated by the RPA were assigned to unique RPA Land Parcel Identification System (LPIS) parcels. These intersected with LCM+ parcels, excluding those where a one-to-one match between the Land Cover® plus: Crops map polygon and the LPIS parcels was not clear due to differing field boundaries or sizes. For those RPA polygons where more than one land use was declared, the predominant crop cover was used for comparison.
LCM+ polygons which did not meet the criteria for spatial matching to a single RPA parcel, or for which the matching RPA parcel was not clearly dominated by a single crop type, were removed from the validation dataset, to ensure that validation only took place where we are confident the two datasets are referring to the same unit of land with a single crop in a given year.
For this quality assessment, we considered that LCM+ and RPA parcels matched if the LCM parcel covered at least 90% of potentially matching RPA polygons, and the area size of both parcels was similar. This similarity is established through a tolerance threshold: the area of each analysed LCM+ polygon has to be more than 90%, and less than 110%, of the area of each potentially matching RPA parcel.
The Land Cover® plus: Crops 2022 dataset consists of crop data of 1,655,942 fields covering an area of 9.7 million hectares. The three most prevalent crop classes amounted to 83.55% of the total: grass (gr, 67%), winter wheat (ww, 11.68%) and spring barley (sb, 4.68%).
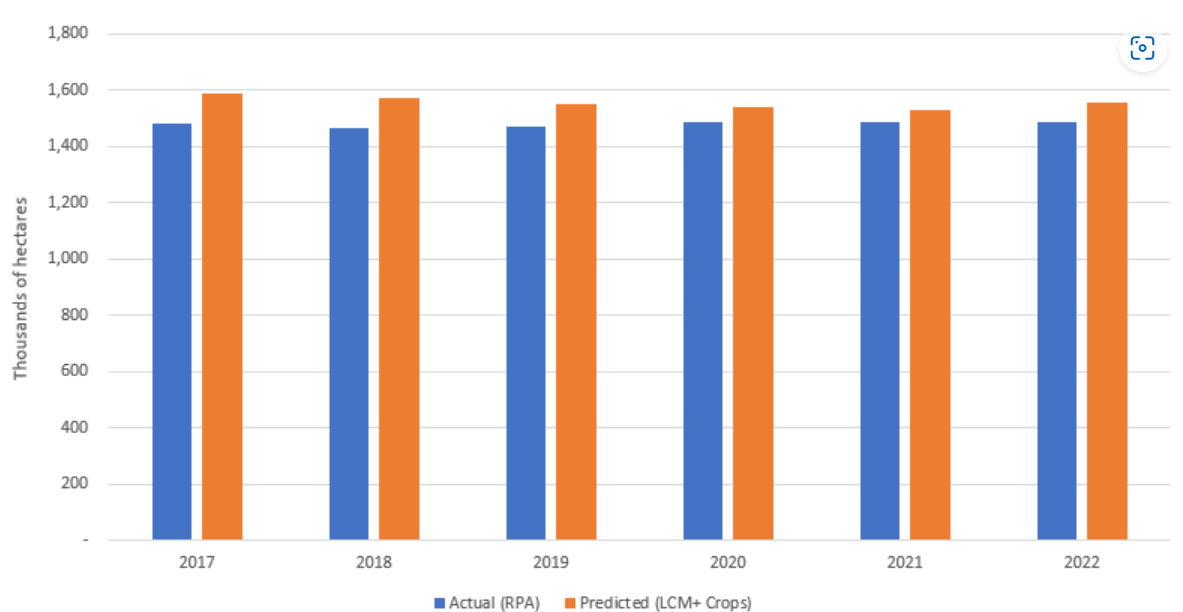
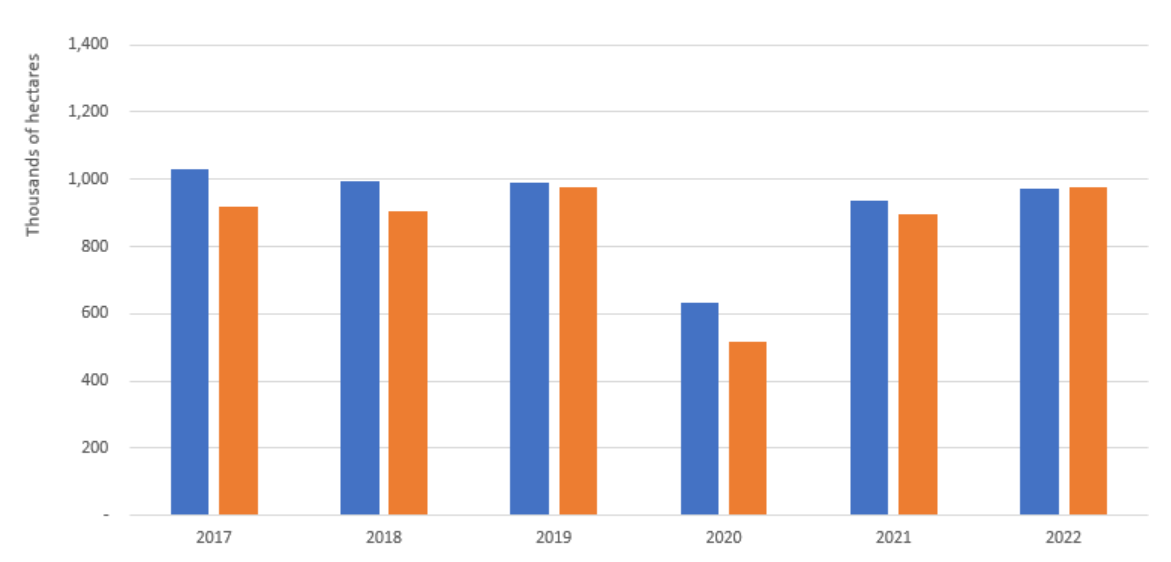
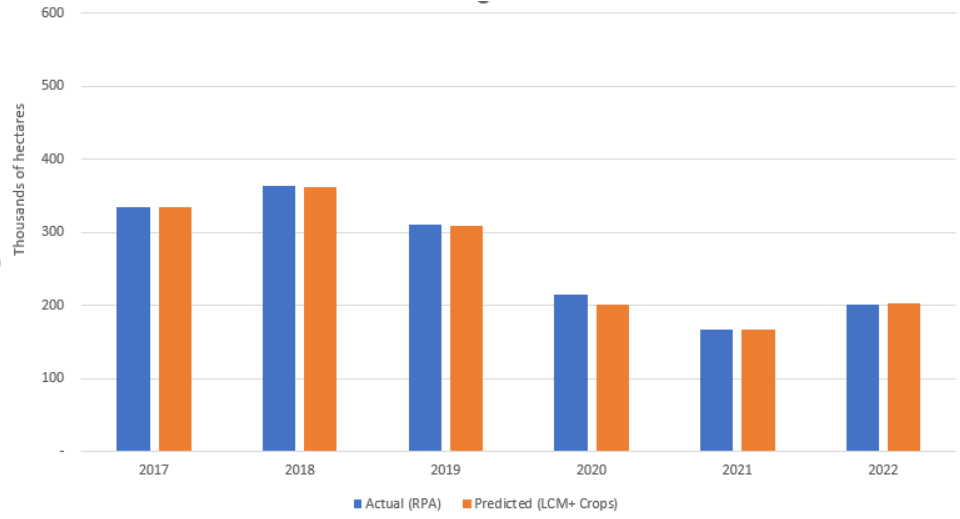
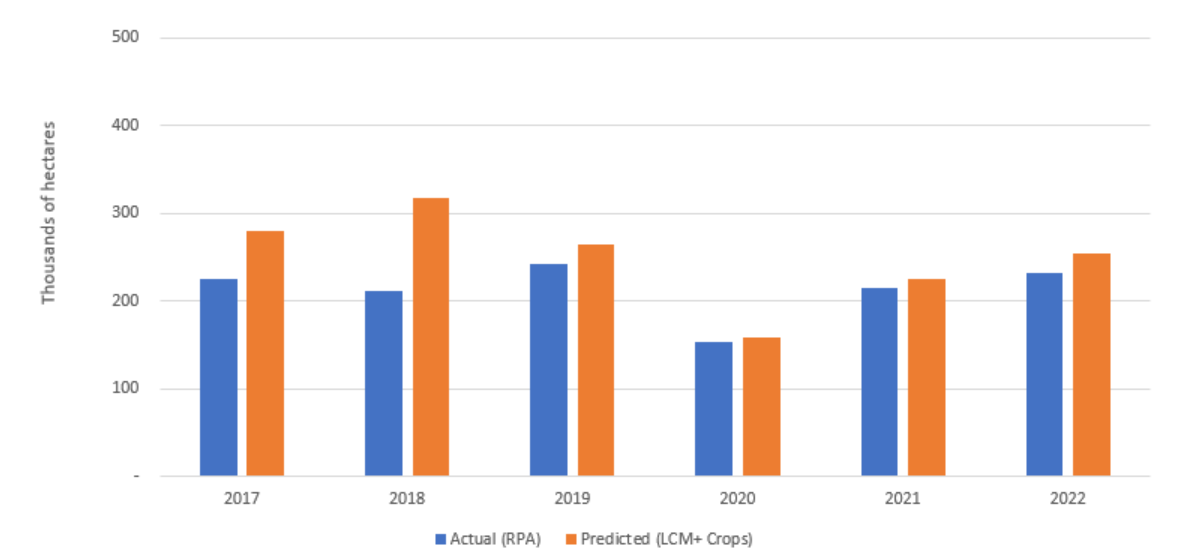
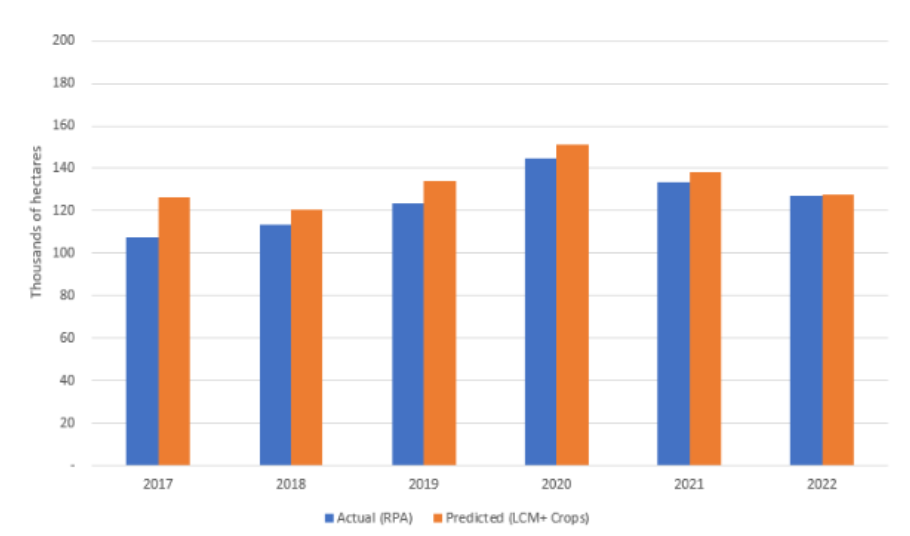
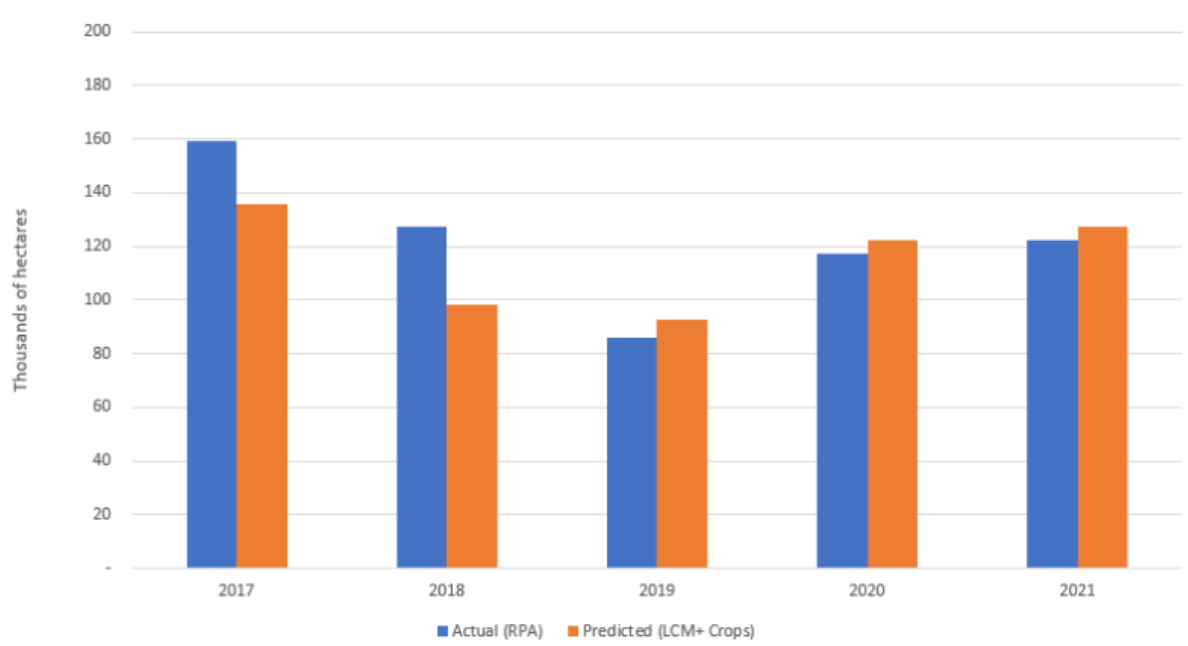
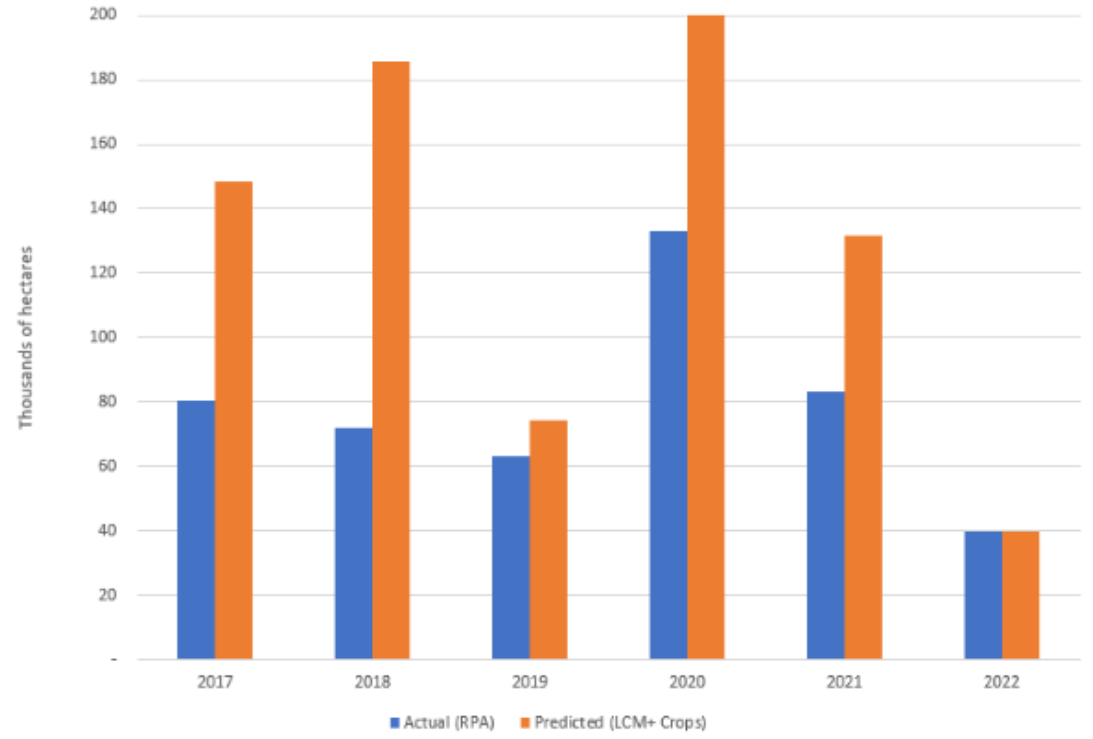
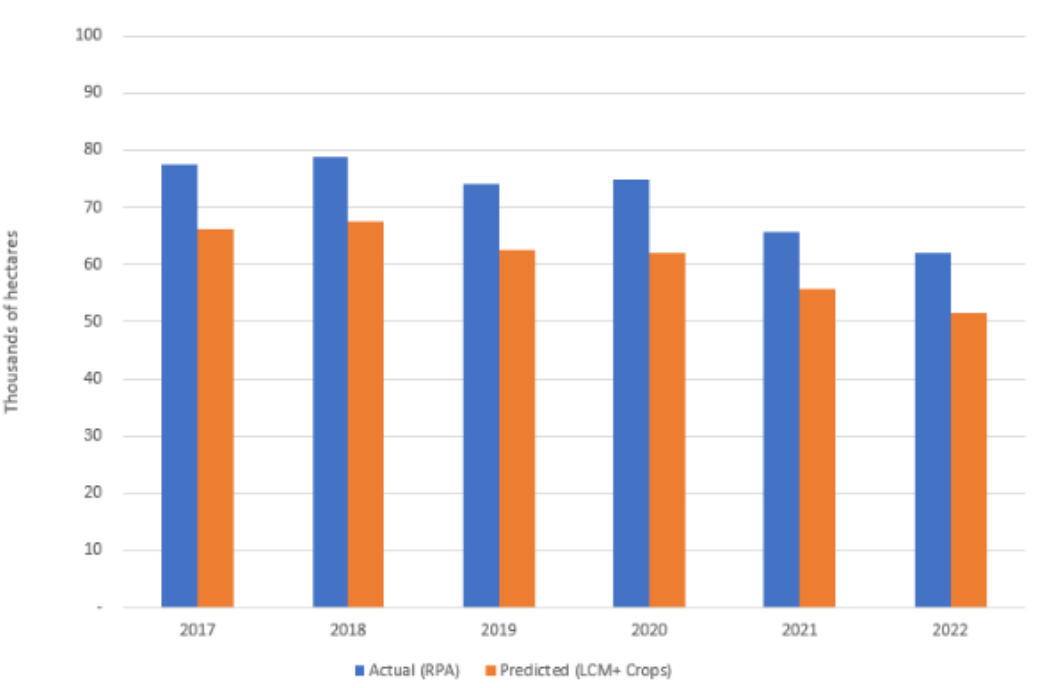
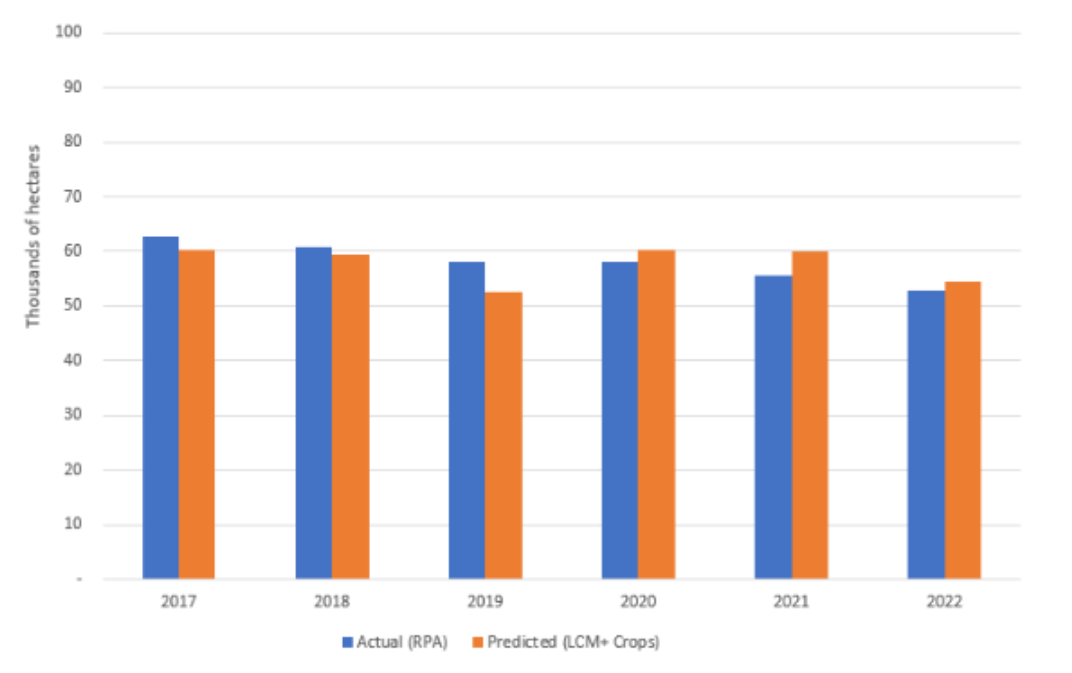
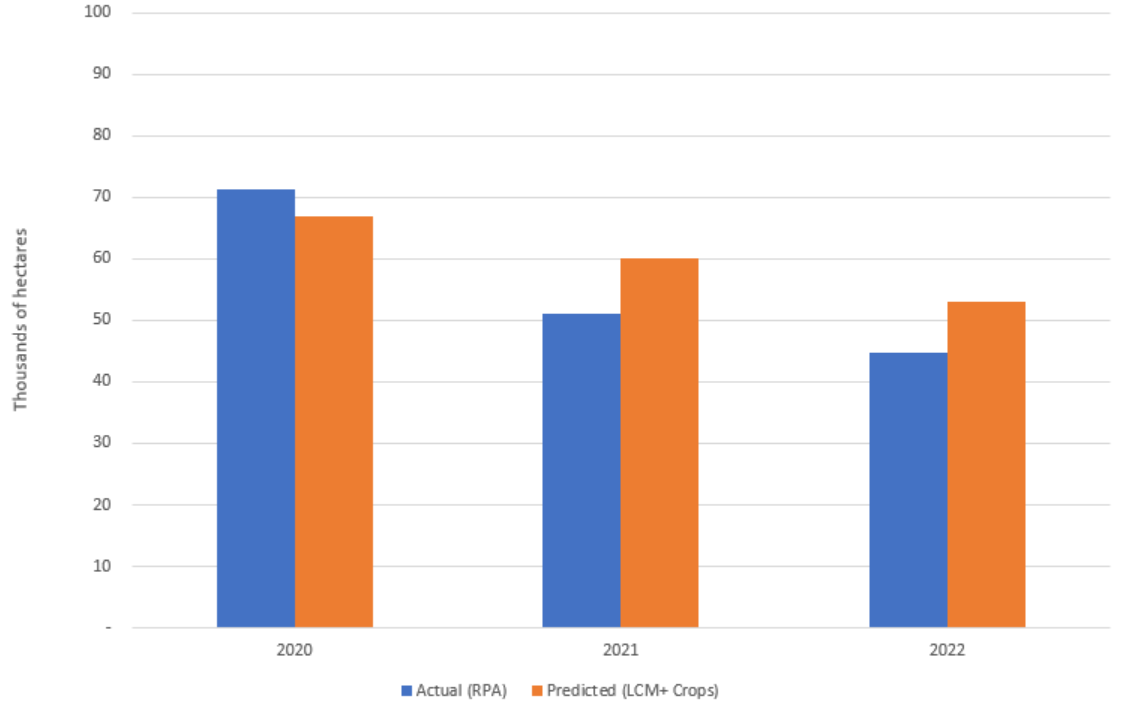
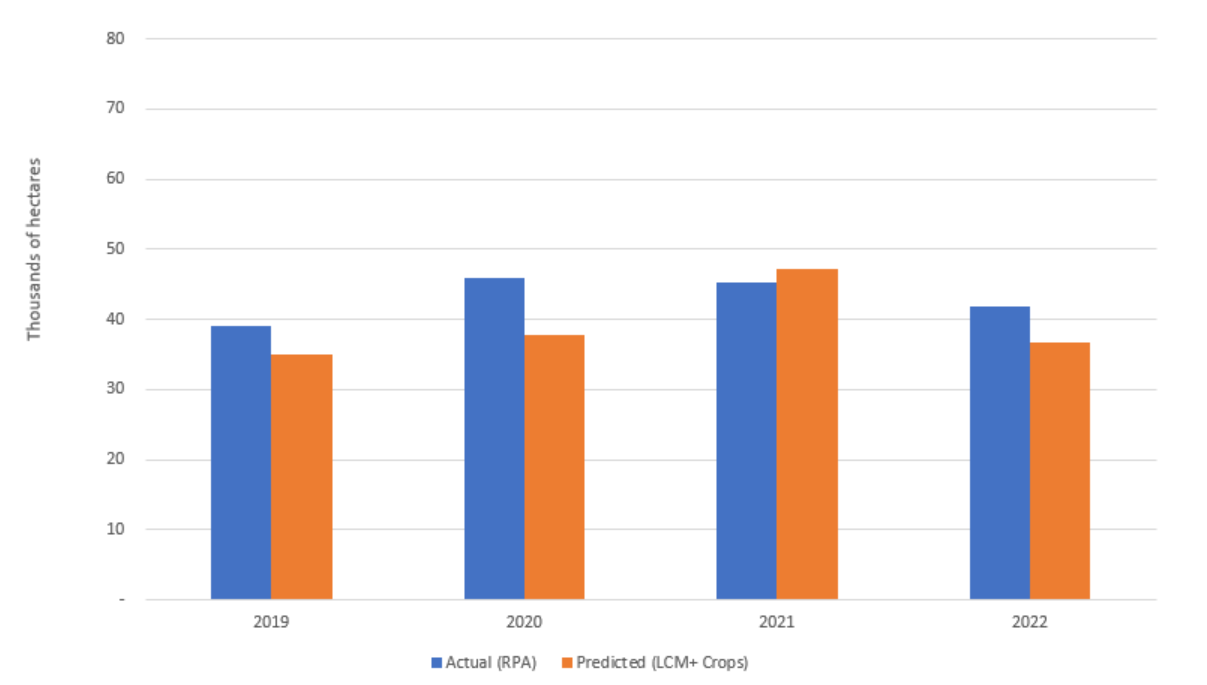
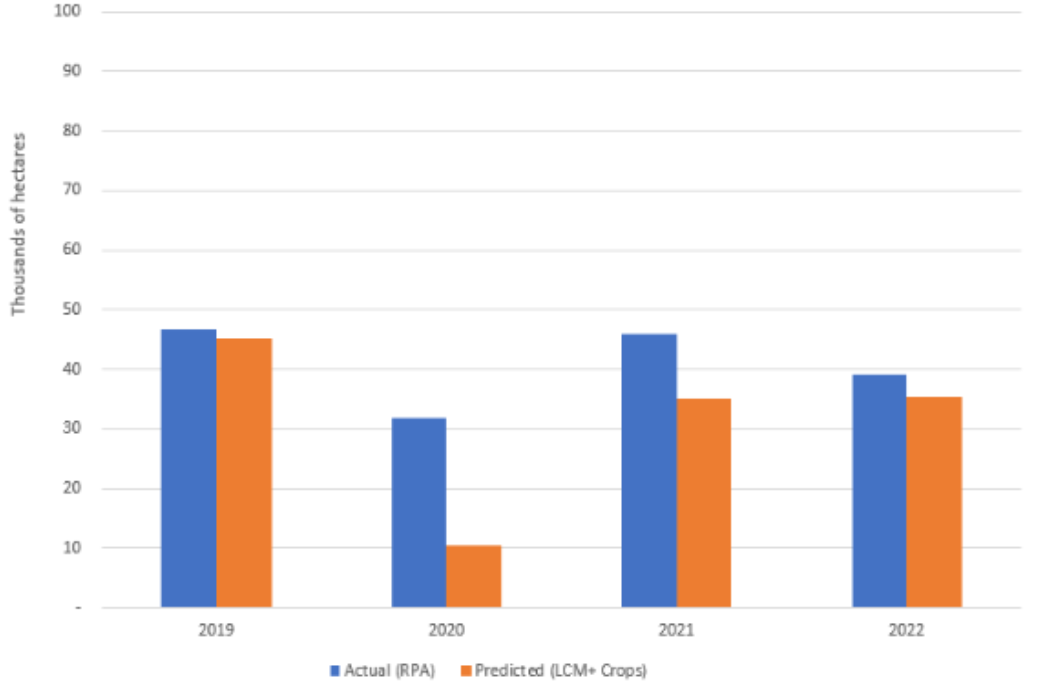
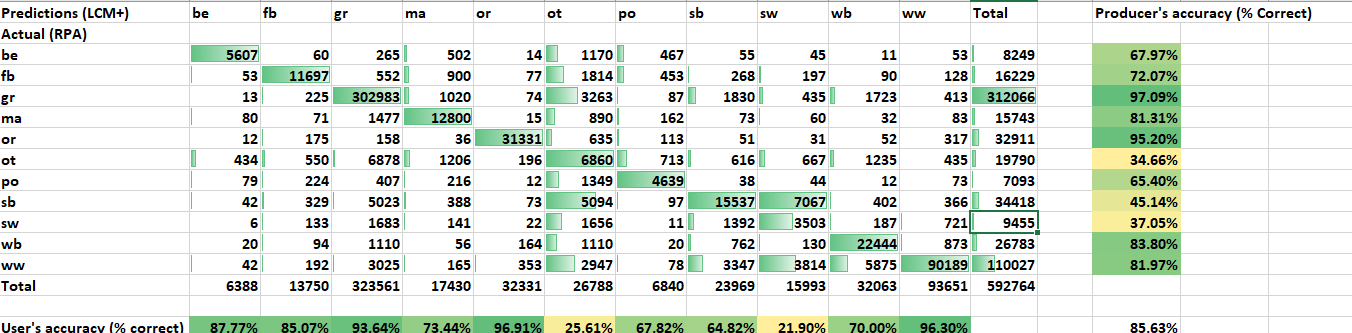
576,512 fields (34.81% of the total) were matched with a corresponding RPA polygon using the threshold described above: for the top 3 crop field types (gr, ww, sb), the actual (from RPA data) and predicted (by LCM+) number of fields were very similar:

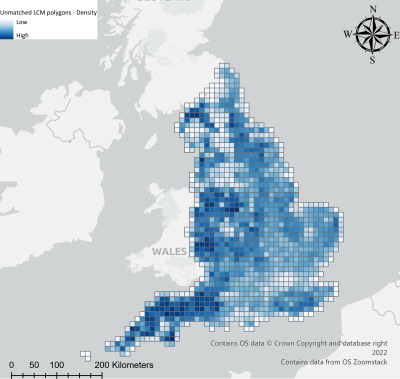
The density of unmatched LCM parcels in England appears to be higher in central and south-western areas, probably because fields in these regions are smaller and more numerous, thus small discrepancies in parcel boundaries in areas will lead to larger percentage mismatches in overlapping area between the datasets.
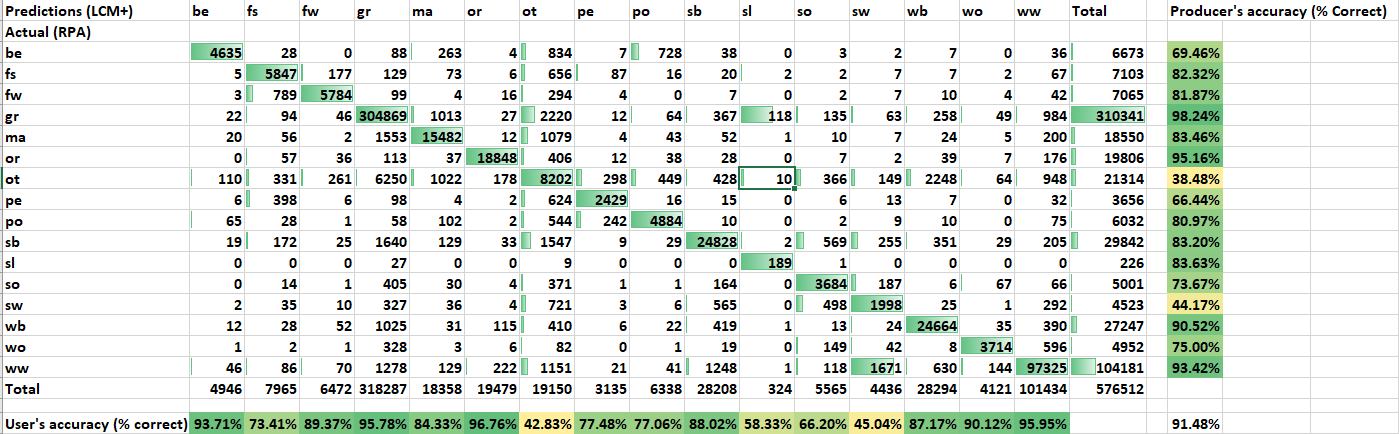
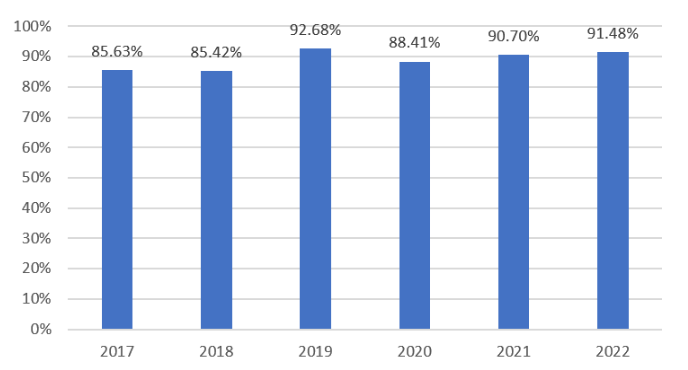
Total accuracy was assessed as overall percentage correct and as kappa statistics, which take account of expected accuracy under random assignment. For 2022, overall percentage correct was 91.48% and kappa was 0.87. This validation approach was repeated for all years with available RPA data (2017-2022). The correspondence tables for each year are shown below:
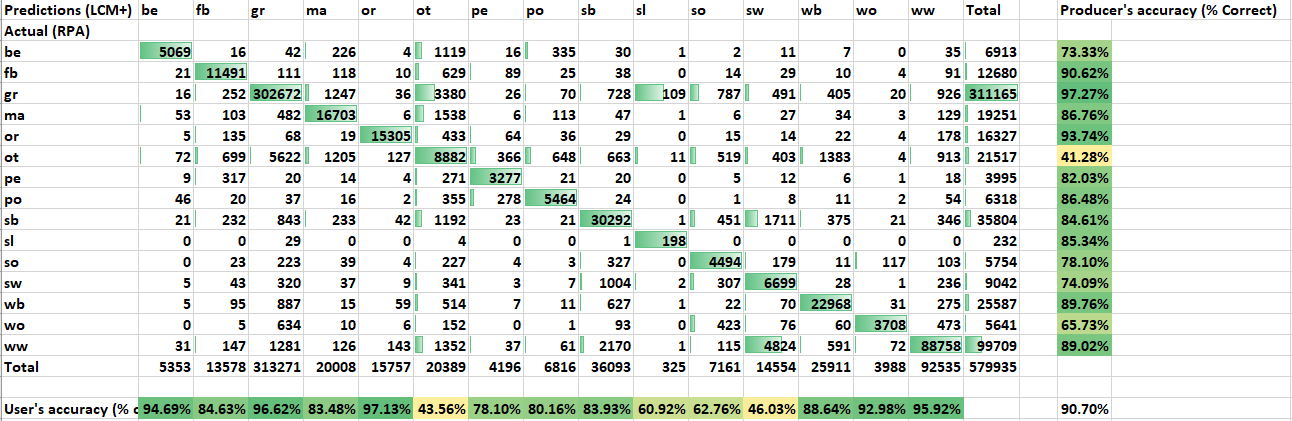
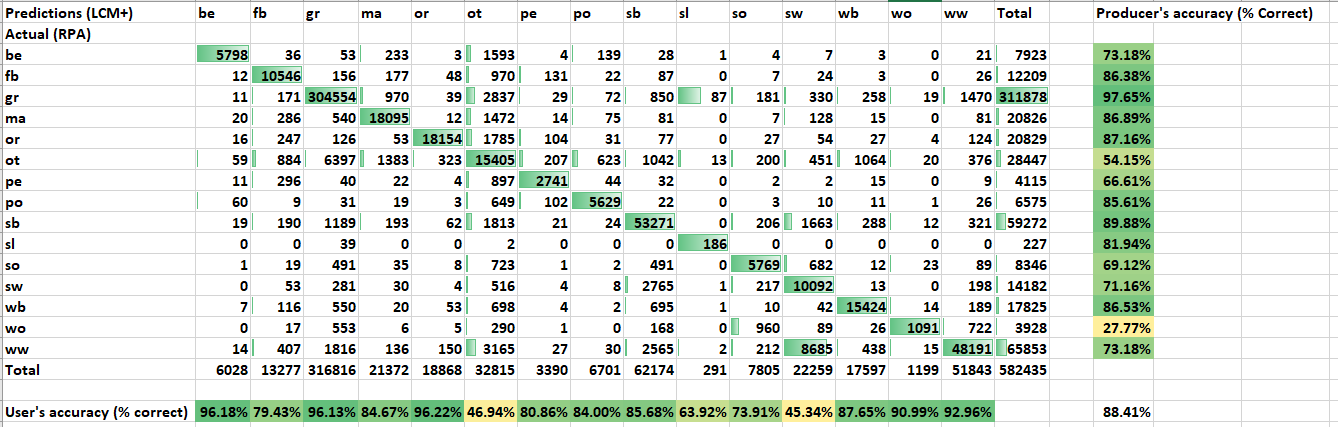
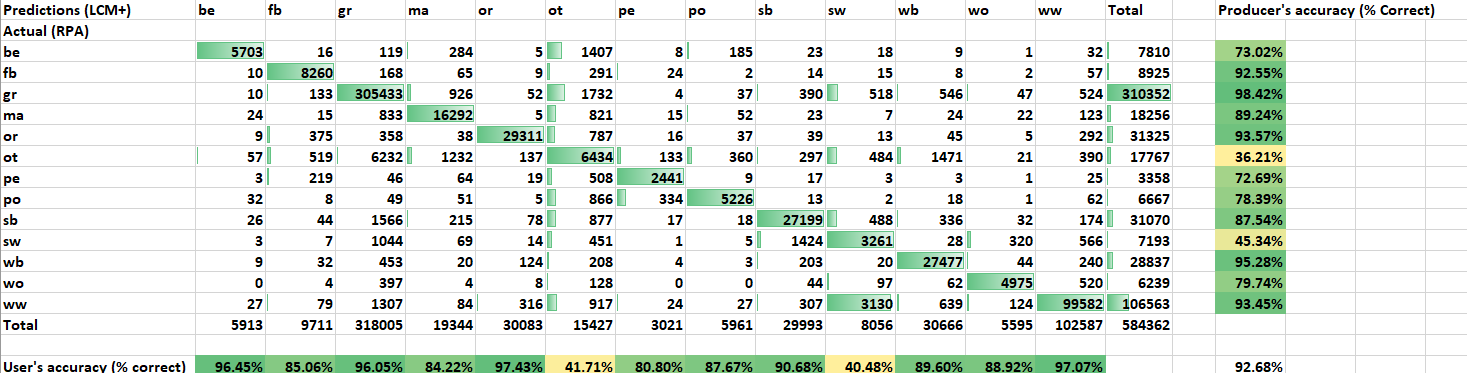
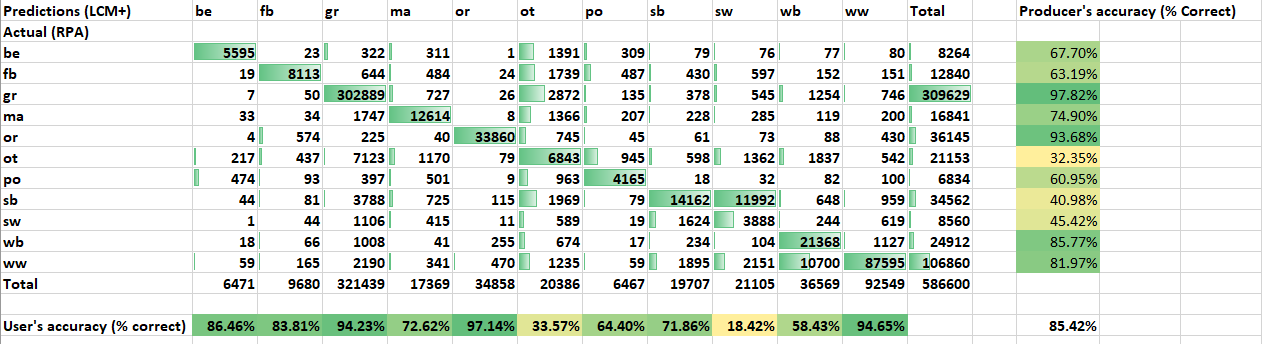
Overall accuracy has been consistently above 85%, but experienced a significant improvement after 2018. Accuracy went up from 85.42% in 2018 to 92.68% in 2019. It has remained largely unchanged since then. It is worth noting that some apparent misclassification is expected, due to the way crops are defined by the two datasets (e.g. spring vs. winter sown crops are defined by timing of sowing in the LCM+ data, and by variety in the RPA data).
Similarly, Cohen's Kappa coefficient rates improved after 2018 and have remained mostly stable since that year.
Ten crop types were used to categorize LCM parcels until 2019, when a new class (peas, pe), was added. The following year, three more categories were applied: sl (solar farms), so (spring oats) and wo (winter oats). Finally, in 2022, fb (field beans) was replaced by two categories: fs (spring field beans) and fw (winter field beans).
From these initial 10 crop types, a core group of seven crop types, including those occupying the greatest area of agricultural land, have enjoyed consistently high accuracy rates (always over 80%) since 2019. For 2022, the average accuracy rate within this group was 91.68%.
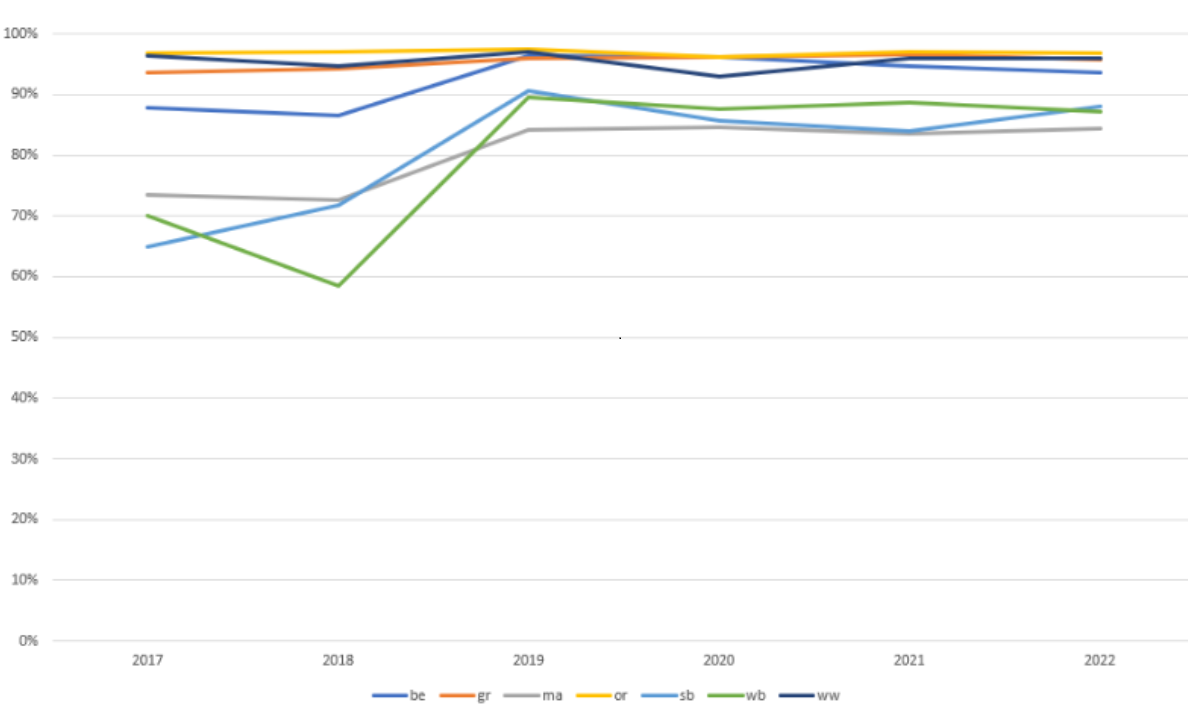
Beyond this core group, the remainder crop categories present different and more variable accuracy trends.
 fs and fw replaced fb in 2020. The 5-year average accuracy for fb was 83.60% in 2021. This good classification performance is mirrored by fb's replacements, fs and fw, with accuracies of 73.41% and 89.37%, respectively, in 2022. wo, introduced in 2020, also enjoys strong accuracy rates, with 90.12% in 2022 and an average of 91.37% for the period 2020 - 2022.
 The 'other' crops class (ot) has remained consistent from 2019, averaging 43.74% accuracy per year for the period since then. This relatively low rate is in line with the fact that for many crops in the 'other' class it is hard to determine the correct Land Cover® plus: Crops class in order to assess accuracy. For example, orchards and perennial crops might be expected to be classified as either 'other' or 'grass' depending on precise crop and management. Additionally, anomalous fields (e.g. poor establishment, crop failure, whole crop harvest) are likely to be classified as 'other'.
 A solar farms class was introduced in 2020 and classification accuracy has averaged 61.06% for the period 2020 - 2022. Additional examination of remote sensing imagery (including aerial photography) suggests that detection accuracy might probably be higher, but the RPA data does not always identify solar farms as such in multiple-use fields.
 Classification of sw (spring wheat) has remained stable and averaged 44.22% for the period 2019 - 2022. This class tends to show a relatively high level of confusion with winter wheat (as expected due to the different definitions of spring vs. winter crops between the two datasets) but also with other spring cereals. Combining spring wheat with spring barley and spring oats into a ‘spring cereals’ class should be considered where higher levels of accuracy are essential.
- Classification accuracy for so (spring oats) has fluctuated since its introduction in 2020. Back then, it had an accuracy score of 73.91%. In 2022, this indicator was down to 66.20%. As above, confusion is generally with other spring cereals.
- The po (potato) class experienced a sharp improvement in accuracy in 2019: from 64.4% in 2018 to 87.67% in 2019.