
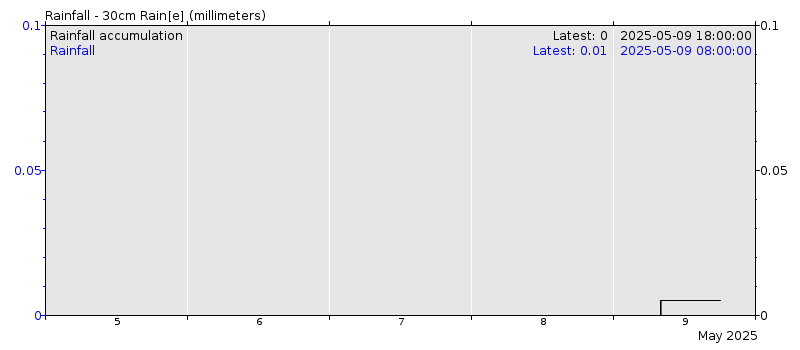
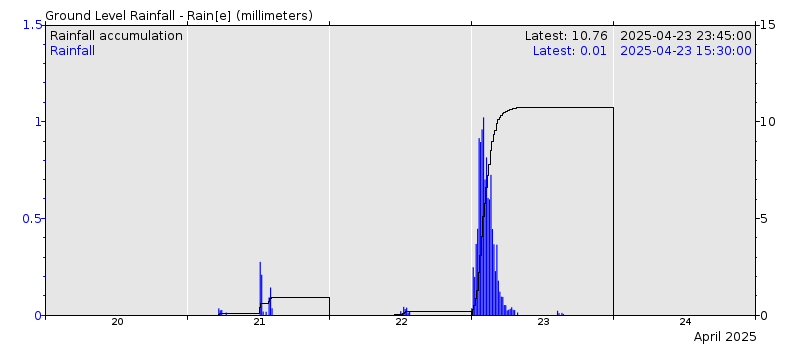
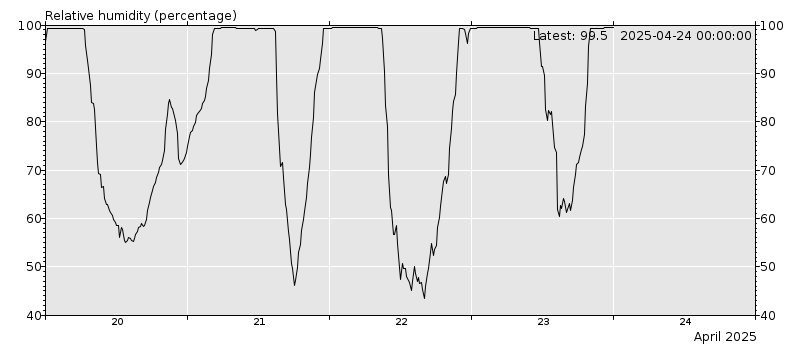
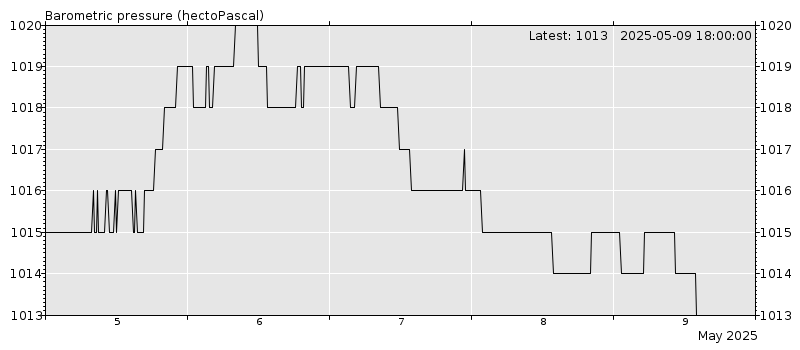
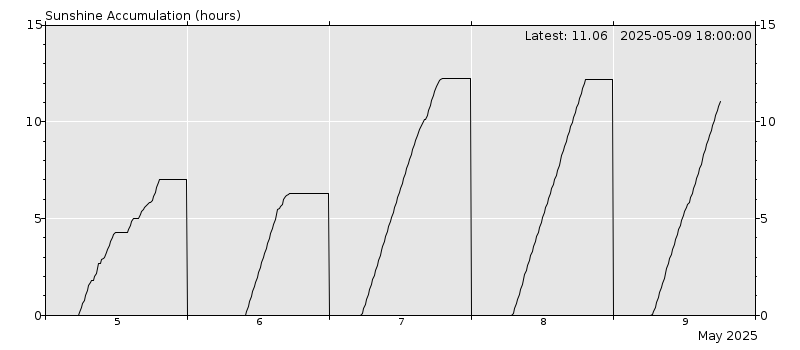
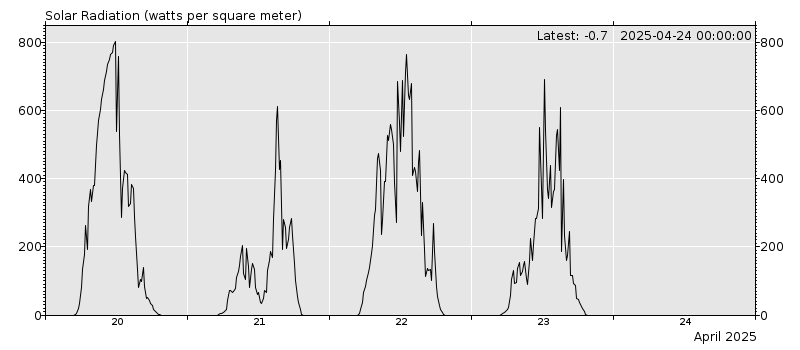
These graphs display the data automatically recorded every 15 minutes from the meteorological station over the last five days. Latest values are shown in the top right hand corner of each graph. Data is updated hourly throughout the day between 06:00 and 18:00 GMT.
Dry bulb temperature
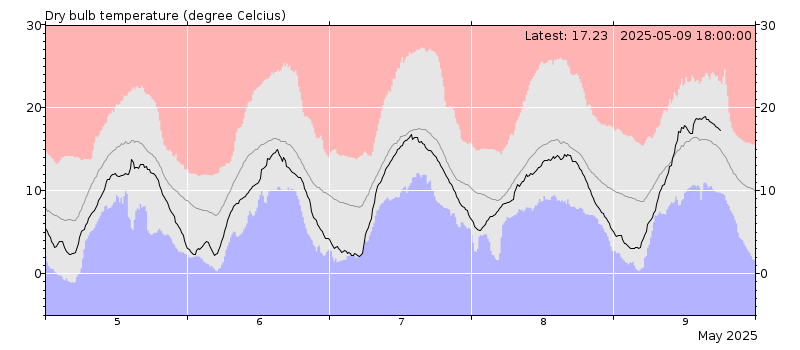
Key: Red and blue areas represent lowest or highest values recorded on each day over the period of record (since November 2001). The grey line represents the long term average.
Rainfall
Ground-level Rainfall
Humidity
Air Pressure
Sunshine Duration
Solar radiation
Wind speed*
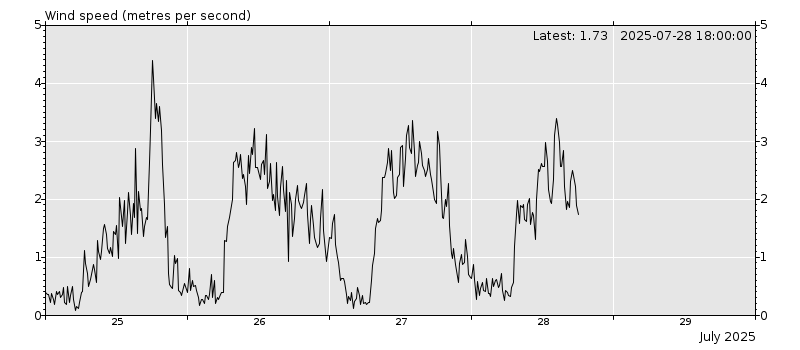
*15 minute average wind speed
Further information
- More information about how the data is measured and used can be found on our meteorological site project page.
- Daily data and observations are submitted to the Met Office and the last 6 months can be viewed on the website. View daily data.
- Current and recent weather can be viewed on this website and full historic data can be requested. The data is available free-of-charge, for further details contact Stephen Turner.