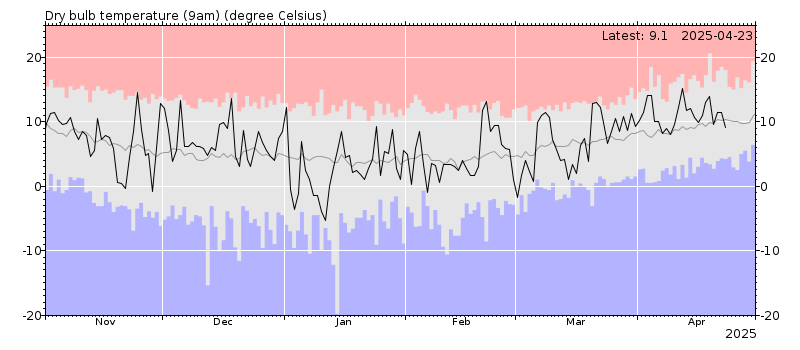
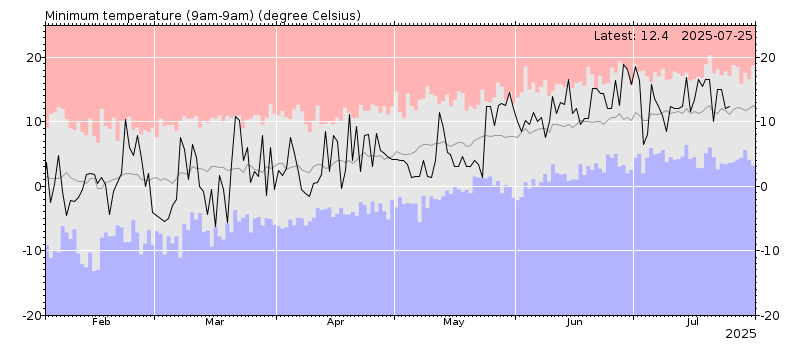
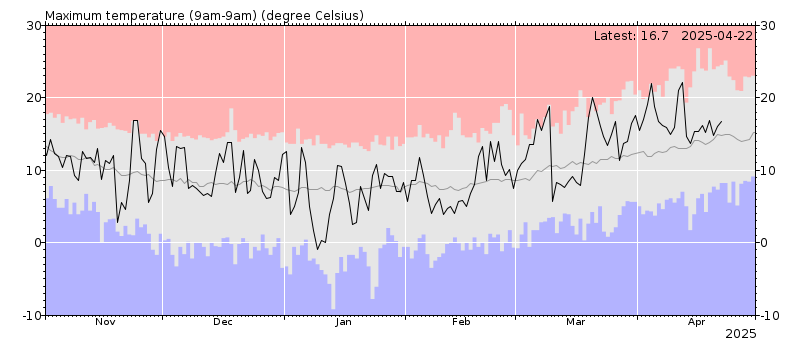
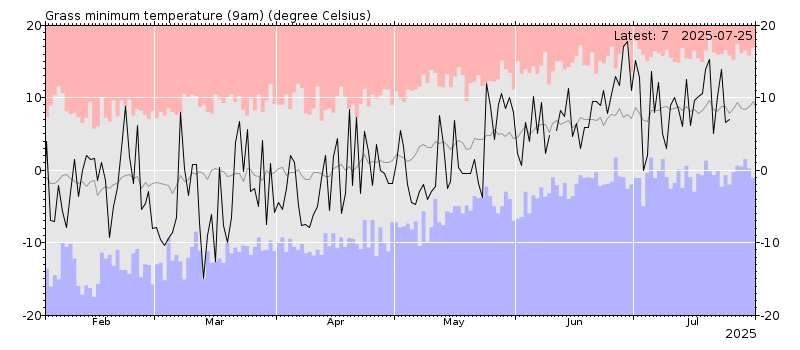
These graphs display the data manually recorded from the Wallingford Meteorolgical Site over the last six months. Latest values are shown in the top right hand corner of each graph.
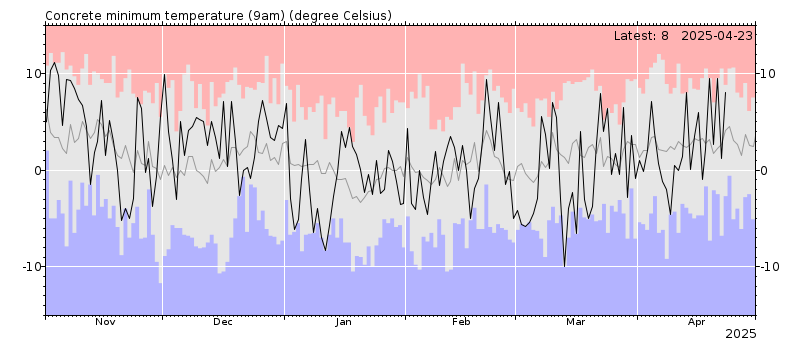
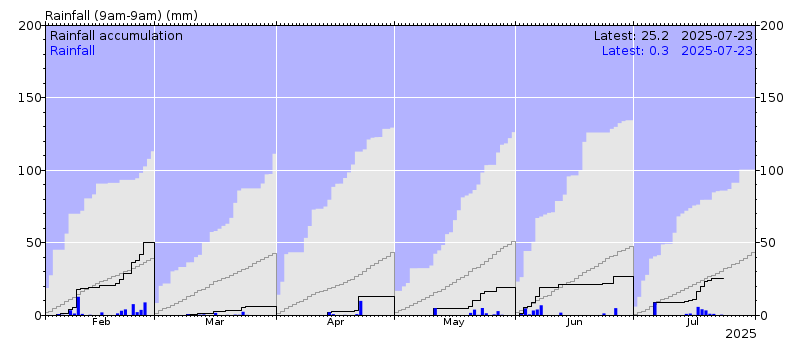
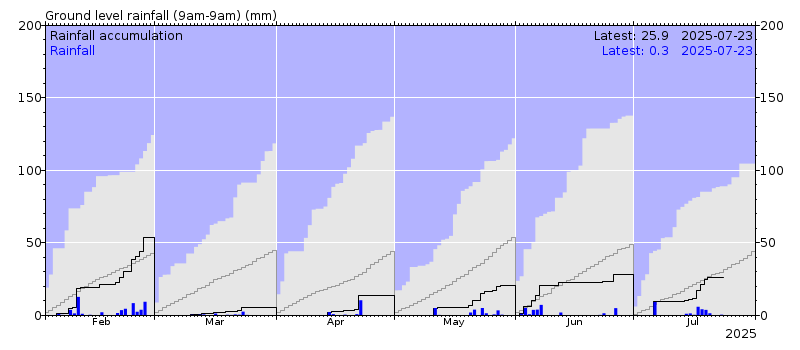
Key: Red and blue areas represent lowest or highest values recorded on each day over the period of record (the narrow envelope in the concrete minimum temperature exists as this has only been measured since May 2011). The grey line represents the long term average.
Dry bulb temperature
Minimum temperature
Maximum temperature
Grass minimum temperature
Concrete minimum temperature
Rainfall
Ground level rainfall
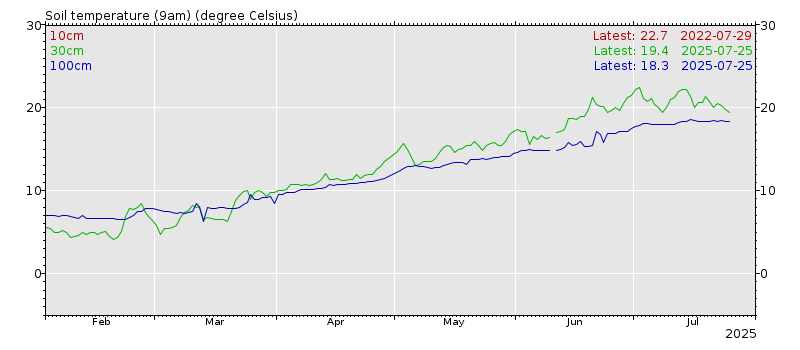
Soil temperatures
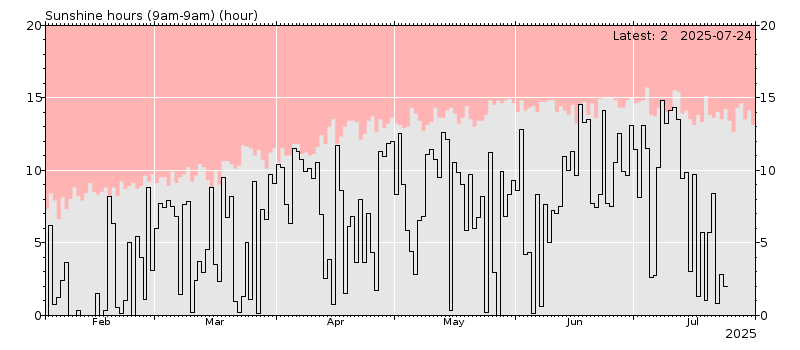
Sunshine hours
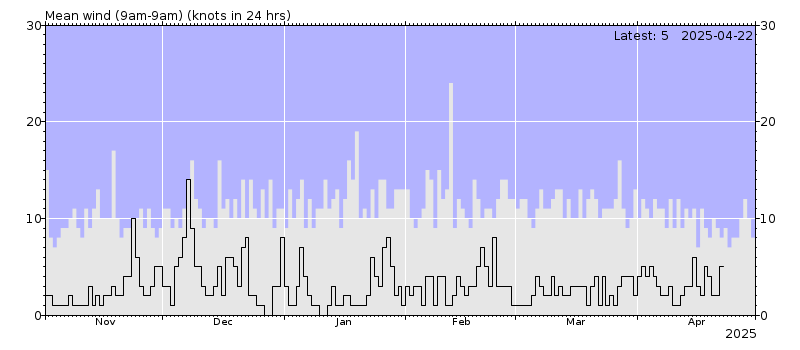
Mean wind
Further information
- More information about how the data is measured and used can be found on our meteorological site project page.
- There is also an automatic weather station on the site. View hourly live data.
- Current and recent weather can be viewed on this website and full historic data can be requested. The data is available free-of-charge, for further details contact Stephen Turner.