Scientists from the National Hydrological Monitoring Programme (NHMP) at UKCEH have been assessing the recent striking hydrological conditions in the UK and putting them in a historical context. Dr Simon Parry explains…
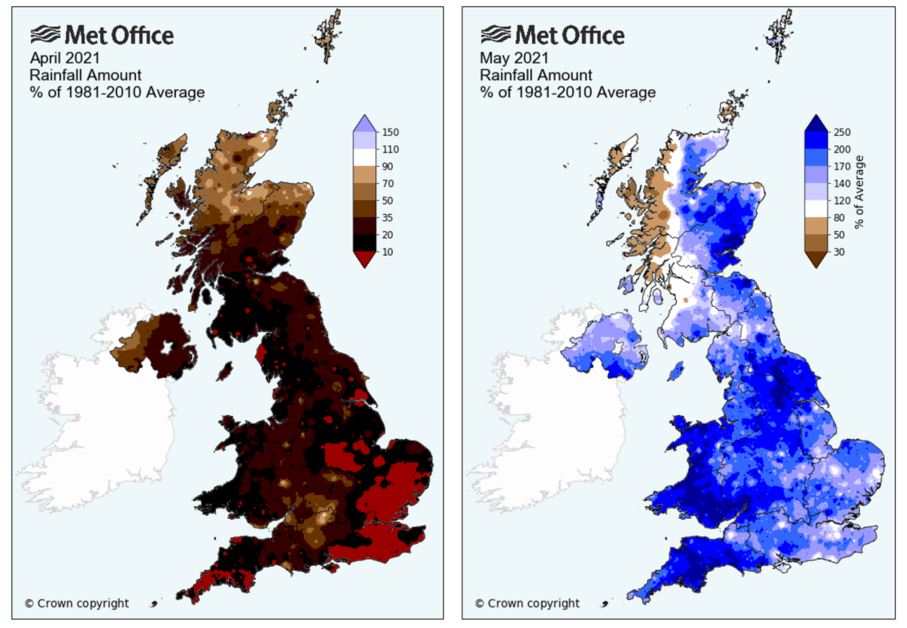
April and May demonstrated the full range of extreme spring weather. Following an April which featured a highly unusual combination of cool and dry weather for the time of year1, May was exceptionally wet. Rainfall for Wales was more than two and a half times the long-term average, the wettest May in a series from 19102.
The remarkable aspect of April-May 2021 was the abruptness and magnitude of the transition from dry to wet conditions. The UK received 20.1mm of rainfall in April and nearly six times this amount (119.5mm) in May (Figure 2). This difference (99.4mm) is the largest of any successive April-May in a series from 1910. It eclipsed the previous maximum in 2007 (a difference of 87.0mm) which heralded the well-known summer 2007 flood episode3, one of the most significant of the last 20 years4. In addition to being the largest dry-wet April-May transition on record, the magnitude of change in 2021 (99.4mm) was also bigger than any wet-dry transition for April-May by some margin (76.2mm in 1998).
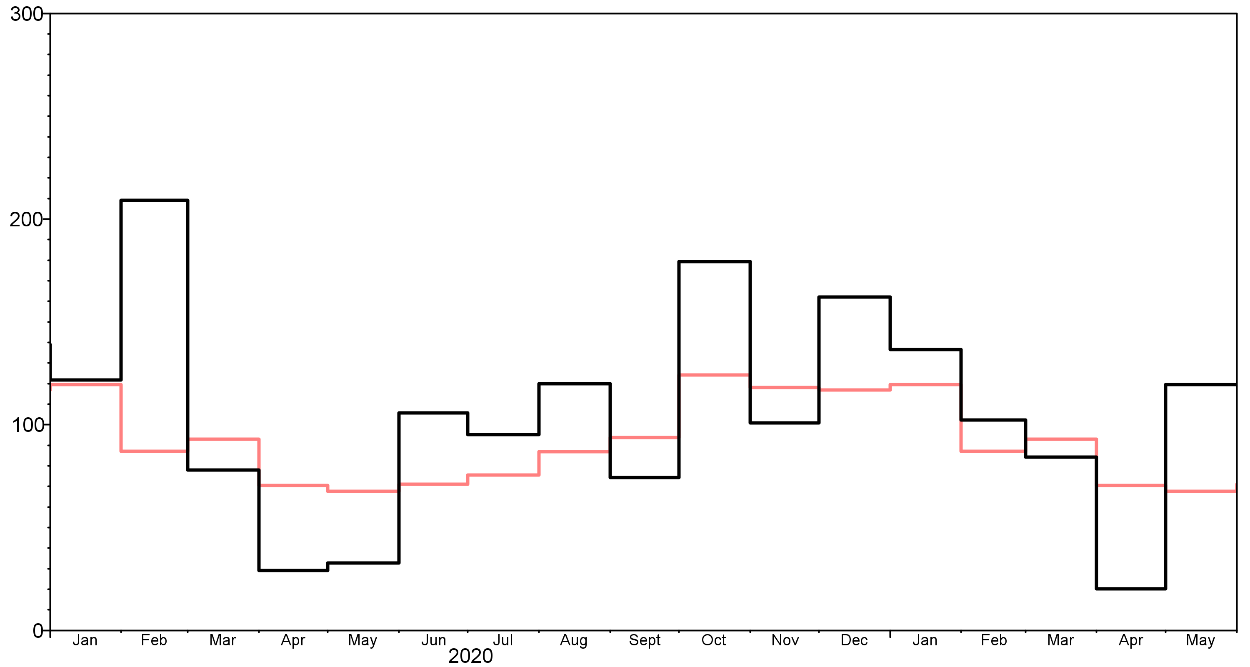
However, limiting analysis to April-May is slightly arbitrary and may exaggerate the rarity of these transitions. The use of rainfall anomalies (the difference between observed rainfall total and long-term average for the calendar month) allows a comparison of April-May transitions with successive months at any time of year. Long-term averages for April and May are actually very similar in the UK but the seasonal cycle of average rainfall (red line in Figure 2 above) highlights the need to consider anomalies rather than absolute totals when assessing historical context for any month.
For the UK, rainfall in April was 29% of the 1981-2010 monthly average, and 177% of average in May. This difference between anomalies (148 percentage points) is the second largest of any two successive months in a series from 1910 (Table 1). This transition eclipsed several previous instances which triggered some of the most noteworthy flood events of recent decades (e.g. Jan-Feb 2020 in sixth; Apr-May 2007 in eighth).
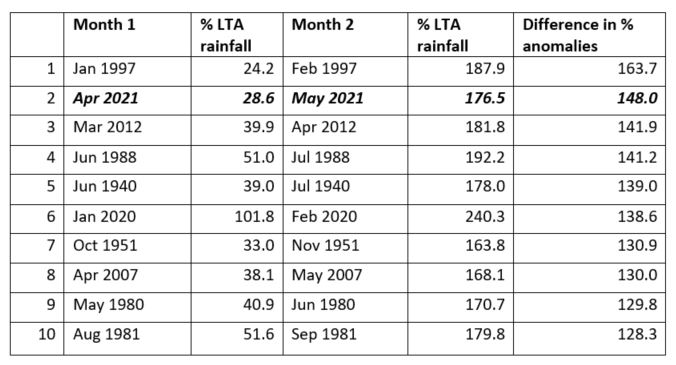
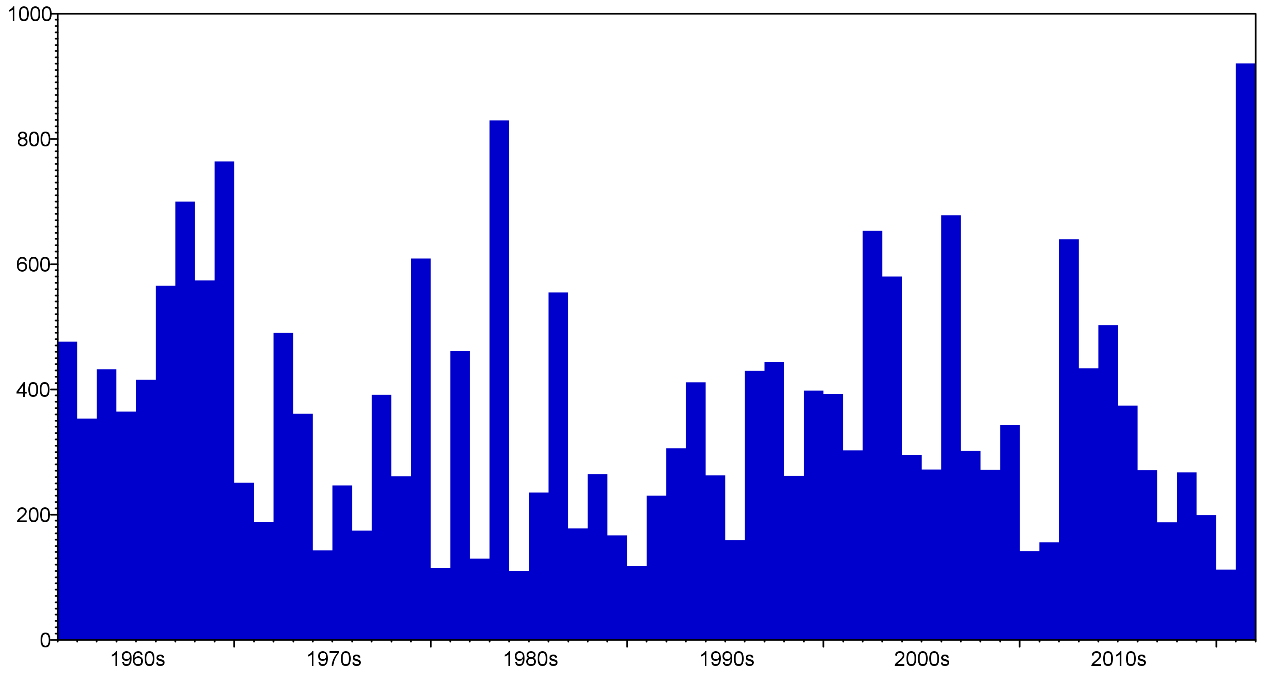
The significance of the Apr-May 2021 transition is underlined by it surpassing the onset of recovery from the 2010-12 drought (third in Table 1 above). The abrupt return of rainfall in April 2012 heralded the wettest April-July period for England and Wales in a series from 1766, triggering repeated widespread flooding over the rest of 20125. The transformation of the hydrological situation in 2012 was slightly different in its switch from multi-year river flow deficits to protracted high flows. Nevertheless, the Apr-May 2021 transformation from very low to very high flows within the span of a single month highlights our highly variable hydrometeorology and how dramatically this can influence the hydrological situation. Mean May outflows from Wales in 2021 were the highest in a series from 1961 (Figure 3), with daily outflows on the 20th/21st eclipsing previous May daily maxima by a substantial margin (>140% of the previous record).
Within the National Hydrological Monitoring Programme at UKCEH, hydrometeorological variability and change is a key topic. In addition to summaries of notable hydrological extremes4,6 and long-term trend analyses7,8, several recent studies specifically addressed the question of variability.
the Apr-May 2021 transformation from very low to very high flows within the span of a single month highlights our highly variable hydrometeorology and how dramatically this can influence the hydrological situation.
Wilby et al9 used statistical models of transition probabilities between dry/wet conditions and low/high flows to better understand the persistence of meteorological and hydrological drought. Some of the most noteworthy transitions from dry to wet conditions occur at the ends of droughts, with Mar-Apr 2012 an extreme example which triggered further research to better understand drought recovery. Other studies explored remaining research questions on drought recovery10, proposed novel methodologies for drought identification and characterisation11, and implemented approaches to forecasting these events12.
'Weather whiplash'
These studies are part of a burgeoning body of research on hydrometeorological variability. In the US, popular science terms including ‘weather whiplash’13 and ‘precipitation whiplash’14 have been coined to communicate in simple terms the abruptness with which conditions change from dry to wet or vice versa. In the western US, increases in both the frequency and magnitude of extreme precipitation reversals are already apparent in observations15. Climate projections also suggest these changes are likely to increase in future14, with impacts on water quality13, ecology and the management of concurrent hazards.
The recent occurrence of extreme examples coupled with projections suggesting this pattern will likely continue in future has helped to establish hydrometeorological variability as a highly topical area of research within the hydrological research community. These potentially disruptive events pose challenges for a range of stakeholders and wider society and further research is needed to better understand their drivers, mechanisms and impacts.
Written by Simon Parry with input from Katie Muchan, Lucy Barker, Stephen Turner, Catherine Sefton and Jamie Hannaford.
References
1 April 2021 Hydrological Summary
2 May 2021 Hydrological Summary
3 Marsh, T J and Hannaford, J. (2007) The summer 2007 floods in England and Wales – a hydrological appraisal. Centre for Ecology & Hydrology. 32pp.
4 Sefton, C, Muchan, K., Parry, S., Matthews, B., Barker, L., Turner, S. and Hannaford, J. (2021), The 2019/2020 floods in the UK: a hydrological appraisal. Weather, doi:10.1002/wea.3993.
5 Parry, S, Marsh, T and Kendon, M. (2013), 2012: from drought to floods in England and Wales. Weather, 68: 268-274
6 Turner, S, Barker, L J, Hannaford, J, Muchan, K, Parry, S and Sefton, C. (2021), The 2018/2019 drought in the UK: a hydrological appraisal. Weather. doi:10.1002/wea.4003
7 Harrigan S, Hannaford J, Muchan K, Marsh T. 2018. Designation and trend analysis of the updated UK Benchmark Network of river flow stations: the UKBN2 dataset. Hydrology Research, 49 (2). 552-567; DOI: 10.2166/nh.2017.058
8 Hannaford J, Mastrantonas N, Vesuviano G, Turner S (2021) An updated national-scale assessment of trends in UK peak river flow data: how robust are observed increases in flooding? Hydrology Research, 52, 699–718
9 Wilby, R, Prudhomme, C, Parry, S, & Muchan, K (2015) Persistence of hydrometeorological droughts in the United Kingdom: A regional analysis of multi-season rainfall and river flow anomalies. Journal of Extreme Events, 2, 1550006
10 Parry, S, Prudhomme, C, Wilby, R, & Wood, P (2016) Drought termination: Concept and characterisation. Progress in Physical Geography, 40, 743-767
11 Parry, S, Wilby, R, Prudhomme, C, & Wood, P (2016) A systematic assessment of drought termination in the United Kingdom. Hydrol. Earth Syst. Sci., 20, 4265–4281
12 Parry, S, Wilby, R, Prudhomme, C, Wood, P, & McKenzie, A (2018) Demonstrating the utility of a drought termination framework: prospects for groundwater level recovery in England and Wales in 2018 or beyond. Environmental Research Letters, 13, 064040
13 Loecke, T, Burgin, A, Riveros-Iregui, D, Ward, A, Thomas, S, Davis, C, & Clair, M (2017) Weather whiplash in agricultural regions drives deterioration of water quality. Biogeochemistry, 133, 7-15
14 Swain, D, Langenbrunner, B, Neelin, J, & Hall, A (2018) Increasing precipitation volatility in twenty-first-century California. Nature Climate Change, 8, 427
15 Marston, M, & Ellis, A (2018) Extreme reversals in successive winter season precipitation anomalies across the Western United States, 1895–2015. International Journal of Climatology, 38, 1520-1532