16.07.2026

Hydrologists at UKCEH have contributed to the annual State of the UK Climate report for the first time. The newly published edition for 2025 looks back at a record-breaking drought which was bookended by persistent rainfall. Rachael Armitage reflects on these transitions... 

Last year saw widespread drought conditions across the country, with the driest spring for 132 years recorded in England and the warmest summer on record in the UK. The remarkable aspect of the 2025 drought was the rapid onset of extreme dry conditions – known as a ‘flash drought’. The drought was then followed by an abrupt transition to wetter than average conditions in the autumn and winter going into 2026.  

This is the latest in a series of alternating extremes in recent years, following on from the 2015/2016 floods2018 drought2019-2021 floods2022 drought and 2023/24 floods, a pattern often referred to as a ‘transition’ – or ‘weather whiplash’.  
 

Image
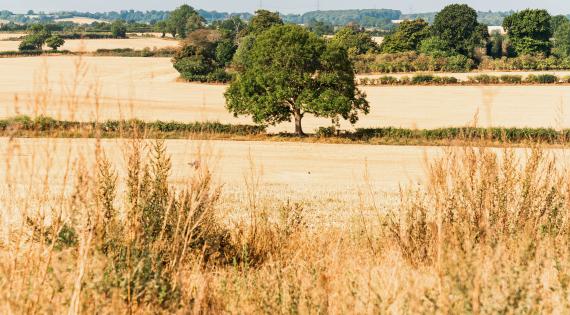
Dry fields. Photo: Unsplash

What is a flash drought? 

In recent years, the term has become more popular to describe drought events characterised by a rapid onset and intensification, like we saw in spring 2025 and 2022. Flash droughts are usually the result of a dry spell combined with high temperatures and clear skies that increase evapotranspiration. This leads to short-term and rapid decreases in soil moisture and increased vegetation stress, severely impacting agricultural and environmental systems within just a few weeks.

Going into 2025, hydrological conditions were relatively healthy for much of the UK. However, this soon shifted to drier conditions, with only about half of the typical monthly rainfall recorded in April (56%), and even less in March (43%) across the entire country. River flows showed a rapid decline from normal and above normal to below normal and, in some places, exceptionally low. Throughout April, river flows decreased across much of the UK and dropped to exceptionally low in the north.  

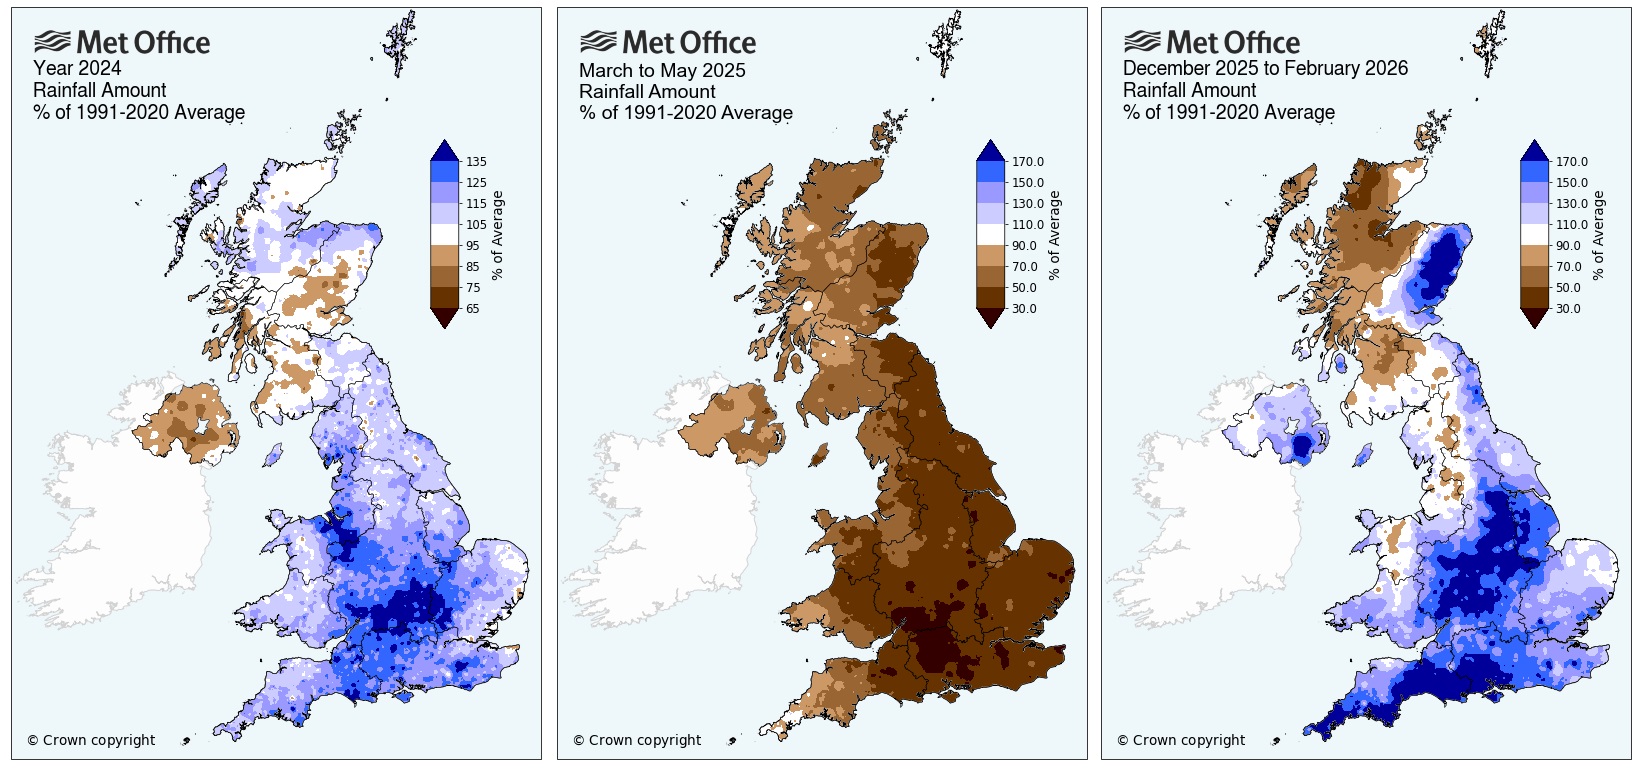
Whilst rainfall deficits were most significant during the spring (56%), the drought continued through summer 2025 (84%). There then came wetter conditions in winter – 114% of average rainfall for the UK as a whole, but over 150% in some regions – which helped ease the pressure on water resources and effectively ended the 2025 drought. We have since seen a return of hot and dry conditions in spring and summer 2026 with river flows, groundwater levels, reservoirs and soil moisture beginning to respond accordingly.  

UK rainfall anomalies 2024 to February 2026
  UK rainfall as percentage of 1991-2020 average for 2024, spring 2025 and winter 2025/2026. 

Transitions like this, from wet to dry and dry to wet conditions, pose a significant challenge for water resource management and can have negative impacts on agriculture and the environment, as well as water quality and availability. Many water management measures and policies are designed for either wet or dry extremes and can be ineffective - or even detrimental - during the other extreme. Opposing extremes in quick succession of one another leave little time for communities to recover or prepare; and may mean resources need to be quickly redistributed or that a change in management approach is needed, which can be challenging to communicate.  

Investigating a year of transitions 

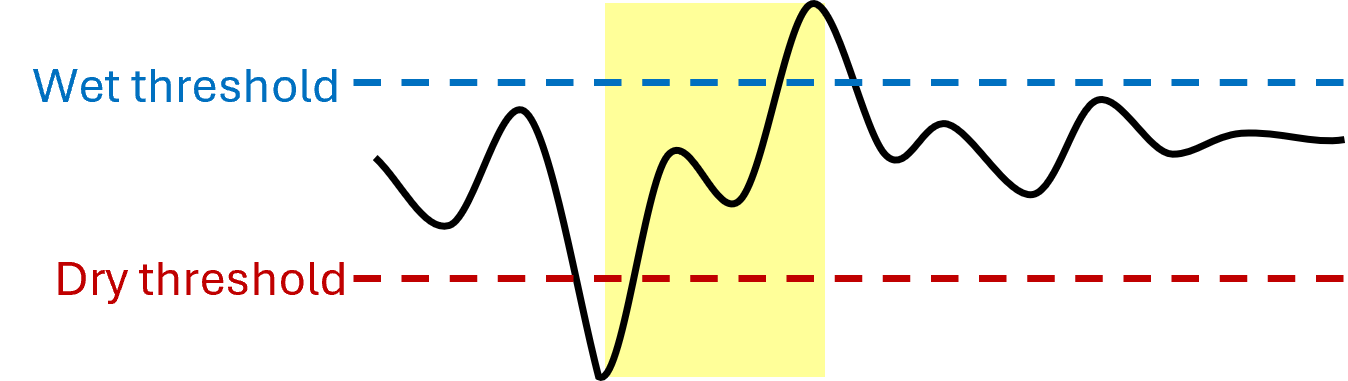
We applied wet and dry thresholds, marking high and low river flows compared to average, to identify these sudden transitions from wet to dry or dry to wet conditions. We also compared the transitions in 2025 with those that have happened in the past.   

Dry and wet thresholds in 2025.
Illustration of how we identify transitions in river flow data, the yellow shading represents the transition - in this case from dry to wet conditions.  

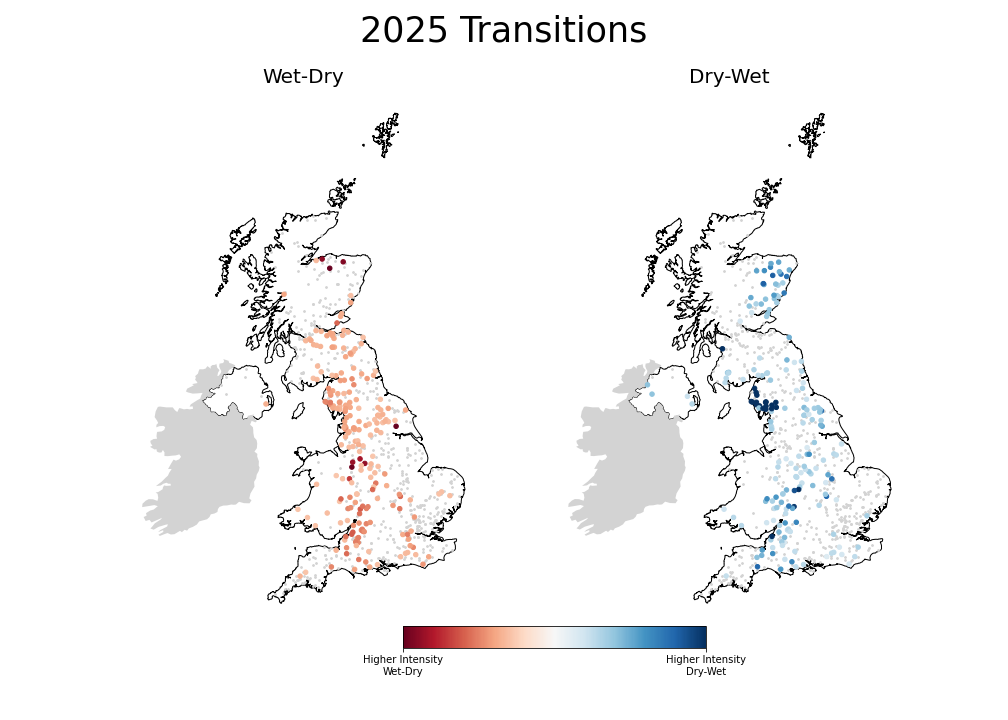
The maps below show that in 2025, many river catchments across England, eastern and southern Scotland, and Wales quickly shifted from wet to dry conditions (red dots). Most of these changes happened in spring when dry conditions developed very quickly - 85% of wet-dry transitions occurred in March, April or May. Rainfall increased later in the year, meaning catchments in northwest and northeast England and eastern Scotland switched again from dry to wet (blue dots) going into early 2026. Of the total number of catchments analysed, almost a third experienced a wet-dry transition and approximately a quarter a dry-wet transition linked to the 2025 drought.  

Map showing intensity of weather whiplash in 2025.

Image
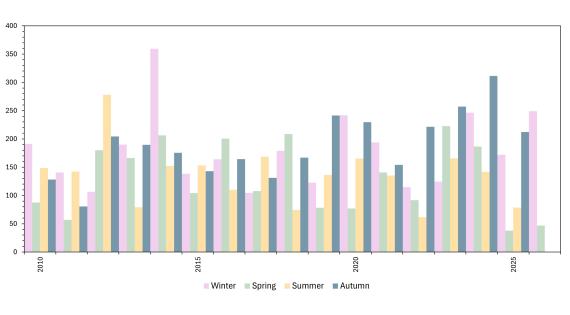
Wallingford met site seasonal rainfall.

Transitions at UKCEH Wallingford 

Rainfall observations taken at our Wallingford weather station demonstrate transitions between seasonal extremes on a local scale. This winter (December 2025-February 2026) was the third wettest winter (in a record since 1962), with a total 249.1mm. This followed spring 2025, the driest of any season recorded with just 37.8mm. The dry spring was bookended by another notably wet season; autumn 2024 was the second wettest autumn recorded with 311.5mm. Pictured left is the seasonal rainfall totals (mm) at the Wallingford weather station since 2010 (full record are available from 1962).

How does 2025 compare with other drought years? 

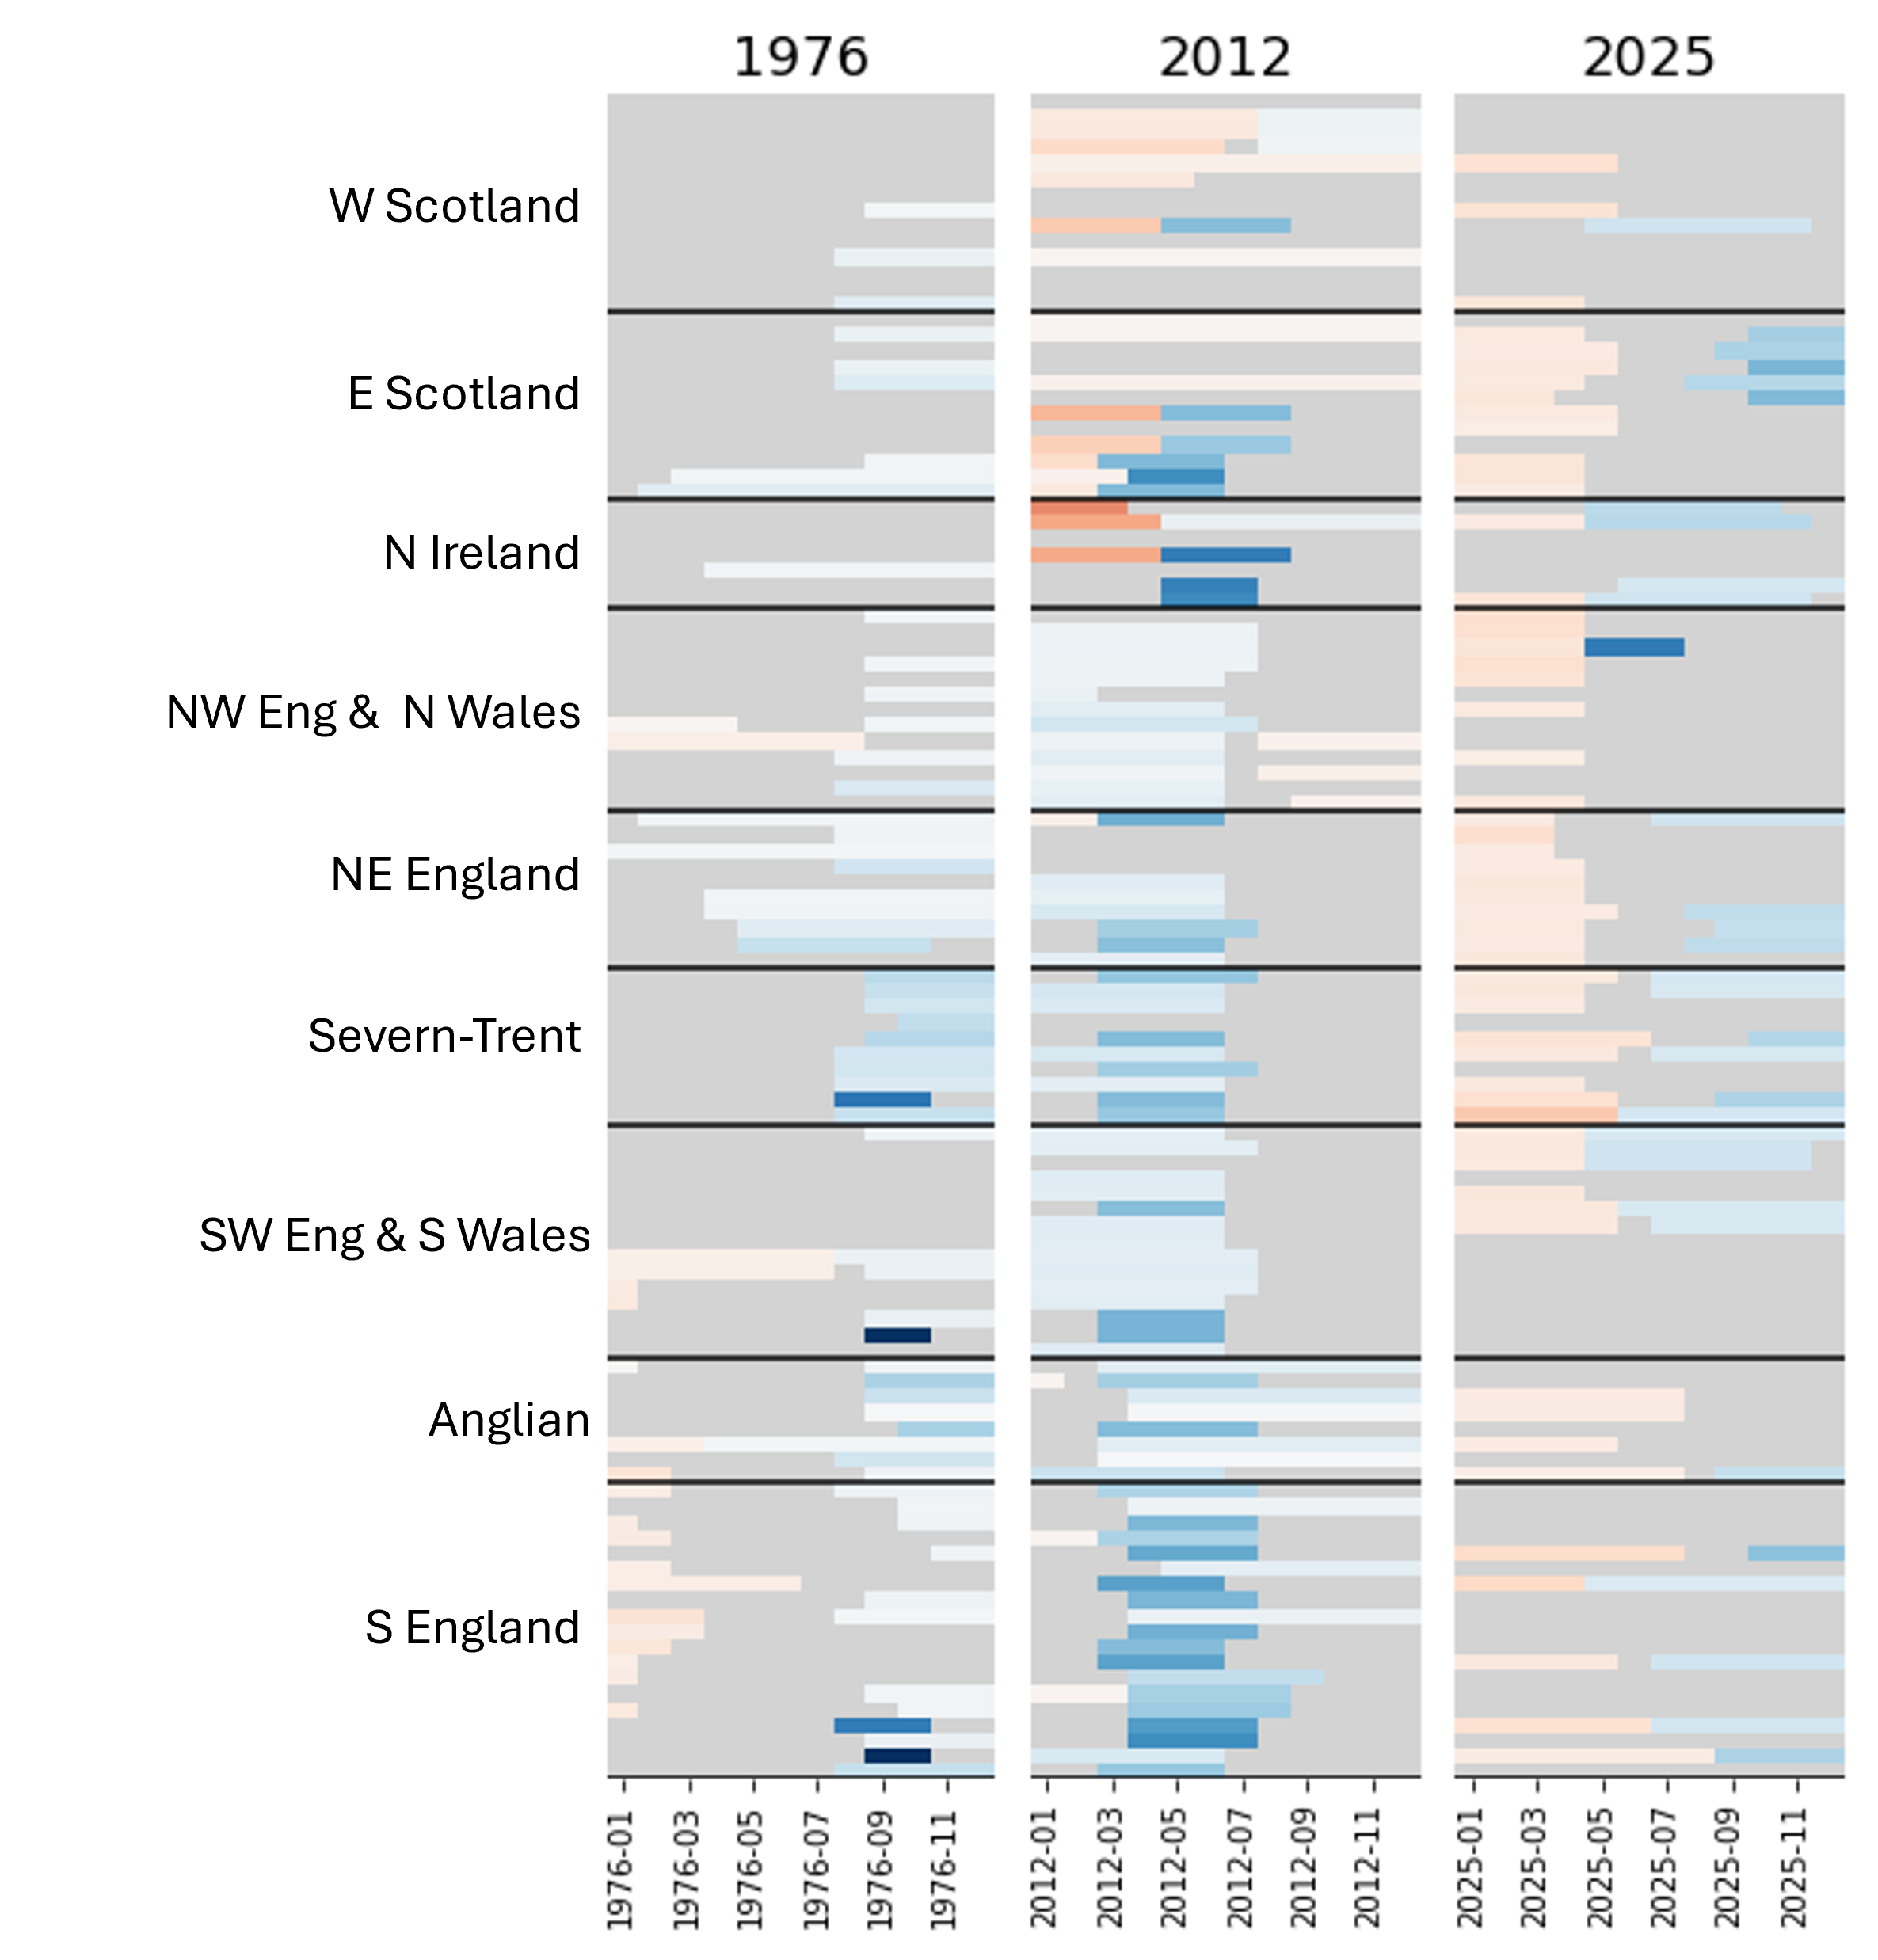
We compared the transitions identified in standardised river flow data from 2025 with 1976 and 2012 – two other notable transition years - for over 100 catchments across the UK used in our monthly Hydrological Summary by the National Hydrological Monitoring Programme. The heat maps below show the transitions recorded in each of these catchments for each year, with shades of blue representing a dry-wet transition, shades of red a wet-dry transition, and darker colours indicating a more intense transition in either direction.  

The droughts in both 1976 and 2012 ended with a sudden shift to widespread wet conditions (a dry-wet transition). The heatmaps highlight the difference in the 2025 drought, which not only ended with a dry-wet transition but also began with a wet-dry transition for much of the country. 

Heatmap showing intensity of weather transitions.
Heatmaps of transition intensity for 1976, 2012 and 2025 for over 100 catchments used in the National Hydrological Monitoring Programme. Red bars indicate a wet-dry transition, blue bars a dry-wet transition. Darker colours indicate higher intensity. Note heatmaps only show transitions with a duration of 12 months or less.

Will there be more weather whiplash in the future? 

Globally, transitions between wet and dry conditions have increased in recent years and are expected to get worse as the climate continues to warm​. Transitions vary spatially across the UK, generally, we see northern catchments showing higher intensity of transitions. 

At UKCEH, we have applied the methods shown above to river flow and rainfall projections across UK catchments to see how we might expect transitions to change in the future. Results from a forthcoming paper suggest these sudden shifts are likely to happen more often and be more intense. Catchments that respond quickly to rainfall, for example in parts of Wales and northwest England, are expected to see the largest changes.  

Recently, UKCEH led the first detailed characterisation of flash droughts in the UK. The results showed that both the wetter regions of the north-west and the drier regions of the south-east can be affected. As flash droughts in the UK are largely driven by hot dry spells, projections of a warmer climate suggest that the frequency of flash droughts will increase, particularly in the south-east, although considerable uncertainty remains and further research is required. 

These rapid swings between wet and dry conditions create major challenges for communities and infrastructure. Further research on their drivers and impacts is essential for effective climate adaptation so we can be better prepared for the extremes of the future. 

With contributions from Iván Noguera Corral, Wilson Chan and Amulya Chevuturi.

Further information 

  • The open access report, State of the UK Climate in 2025, has been published by the Royal Meteorological Society in The International Journal of Climatology, DOI: 10.1002/joc.70470.
  • Explore near-real time rainfall, river flows and soil moisture data on the UK Water Resources Portal
  • We will be reflecting on the current dry conditions in 2026 in an upcoming blog post!