Jamie Hannaford, Principal Hydrologist at the UK Centre for Ecology & Hydrology, looks at the current water resources situation and how it may evolve in the coming months using our Hydrological Summary, Hydrological Outlook and interactive water situation monitoring tools.
Given the current low river flows, soil moisture and groundwater levels and reservoir levels, there is inevitably increasing concern over prospects for water resources this summer.
Increased demand from the heatwave has put short-term pressure on water supply, and should river flows continue to fall, there will be growing threats to water supply later in the year. Even now, low river flows are causing environmental stress in aquatic ecosystems and the dry soils have resulted in challenges for farmers, caused stressed terrestrial habitats and severe wildfires following the recent heatwave.
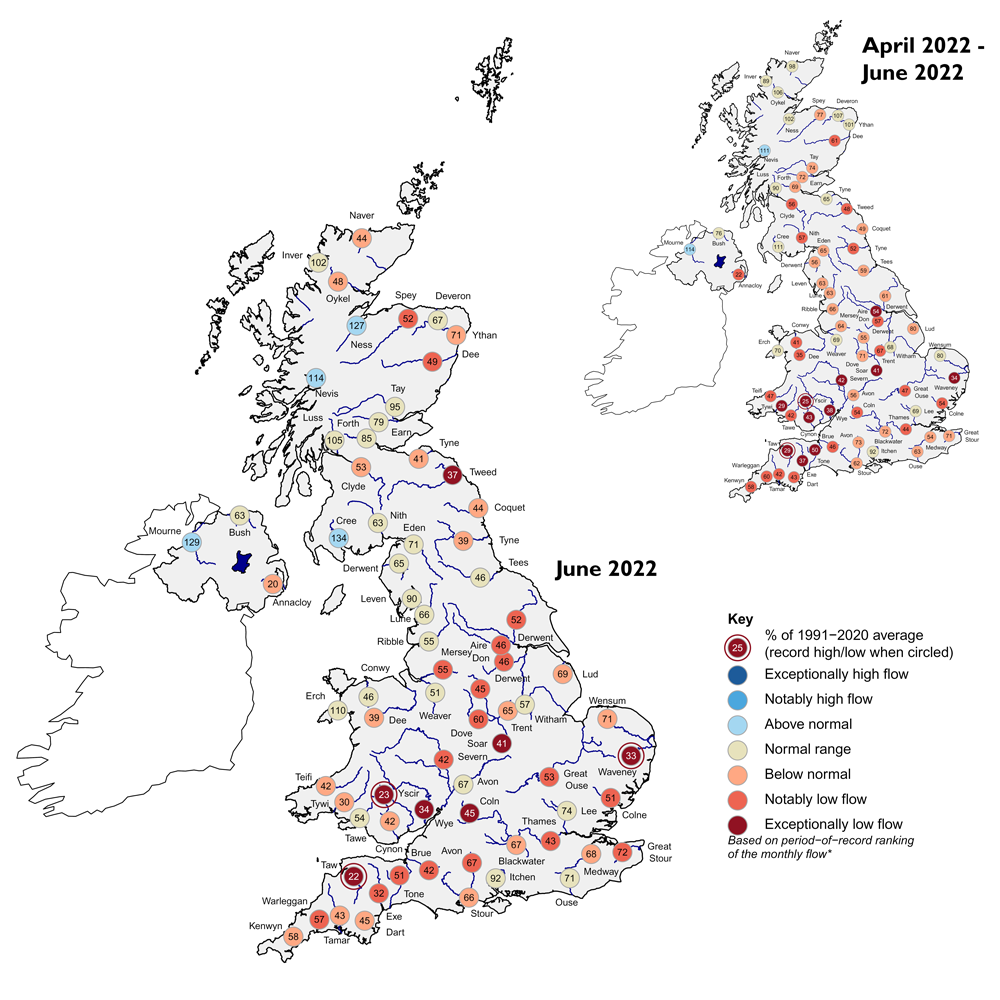
The recently published Hydrological Summary documents the UK water resources situation, based on data up to the end of June. We can see that average river flows for June were categorised as ‘below normal’ or ‘exceptionally low’ across most of the country and the lowest on record (for the month of June) for some rivers – for example, the Yscir in south Wales, the Taw in Devon, and the Waveney in East Anglia. The map below shows that river flows for many catchments have been exceptionally low since the spring (April-June 2022).
The most up-to-date picture of the hydrological situation is provided by our UK Water Resources Portal, which provides near real-time data on river flows across the country (in practice, the most up-to-date data is from a few days before the current day)
The Portal for 18 July shows that across nearly all of the country, river flows were below normal and in most cases in the ‘notably low’ or ‘exceptionally low’ category for that day. Rivers can vary a lot day by day, so this is only a snapshot and a fuller assessment will be made of the July river flows when we get to the end of the month.
How does the current situation compare to previous years?
People often ask how severe the current situation is compared to historical events - the Portal also allows us to investigate this interactively. The ‘five droughts’ plotting style allows the user to look at current river flows compared to five pre-selected drought events of national significance.
For the two examples shown in the graphs below - the Taw in Devon and the Ouse in Yorkshire - we can see that the river flows in recent days were lower than in these five historical episodes (including 1984, 1990, 1997 and 2011, as well as the drought of 1976, which is often held up as a yardstick).
In some of these past events (notably 1976), flows continued to decrease throughout the summer to record low flows later in summer, whereas in others late summer rainfall brought recovery. So while in some catchments the current status is certainly comparable to past drought years, more comprehensive comparisons will be needed next month and beyond.
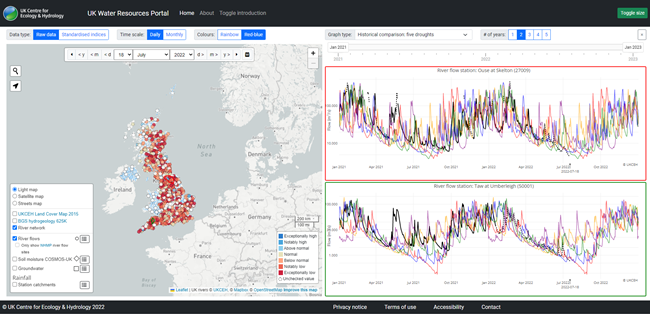
These events are pre-selected, but the most severe historical droughts vary significantly around the country. The Portal also allows users to look at any given year of interest. For example, we know that 1995 and 1996 were especially significant in the north of England, and the Portal allows us to look at how the current river flows for the Ouse are below the equivalent at this time of year for those two periods.
At the present time, it is clear exceptionally low flows are widespread across the country, and in many rivers are either approaching, or below, the flows at the equivalent time of year during past drought episodes.
Soil moisture
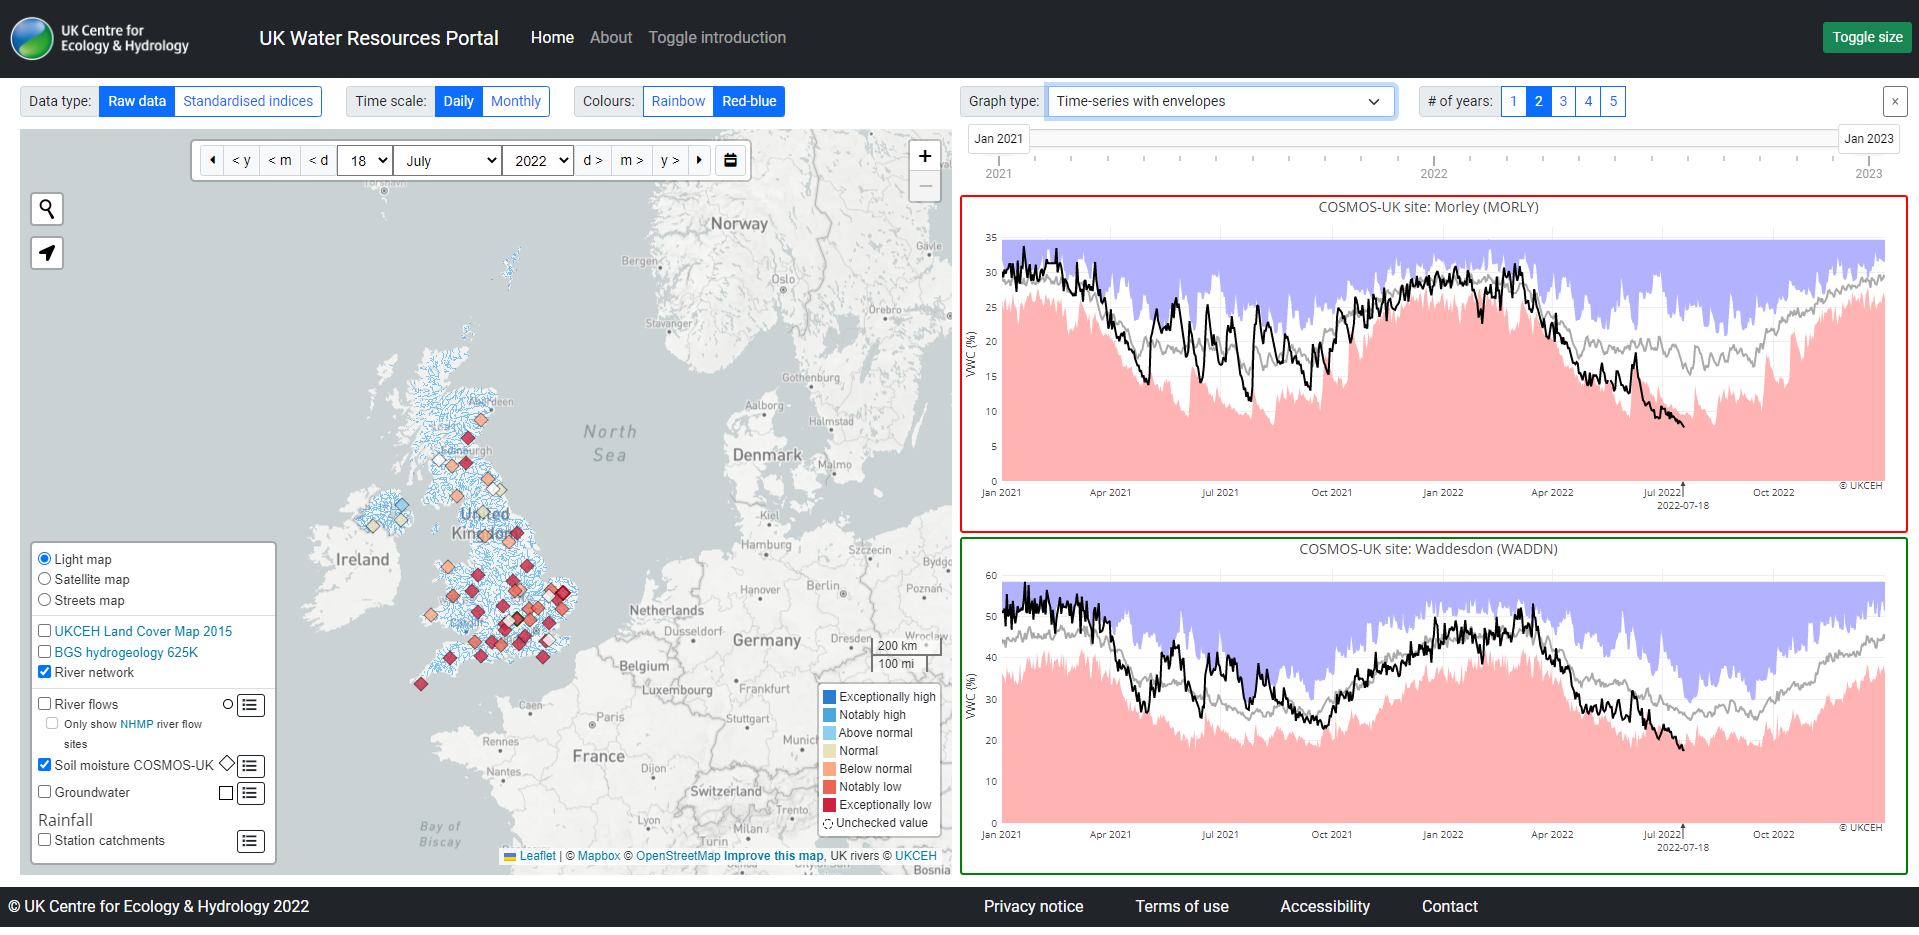
Soils have also dried up throughout this spell of dry and hot weather, given the low rainfall and high evaporation rates, as we can see from data gathered through our COSMOS-UK network. Soil moisture content on 18 July was exceptionally low for many sites in southern, central and eastern England, and was the lowest recorded at some sites since recording for soil moisture began in 2013.
Groundwater and reservoirs
The Hydrological Summary also shows the groundwater and reservoir status for June, and for groundwater this data is also available on the Portal. These datasets are not yet available in near-real-time, therefore this is currently the most up-to-date snapshot we have.
Groundwater levels were below normal or notably low in many boreholes around the country, but rarely at exceptionally low levels, with the exception of parts of the Carboniferous Limestone in south Wales. In many aquifers, notably the Chalk aquifers of lowland England, these below normal levels are a response to the long-term dry conditions, including the previous winter and spring rather than the recent heatwave conditions.
Reservoir stocks were also substantially below average, reflecting the picture for river flows and were the lowest on record for June in Wales. In some other reservoirs, stocks were 20% below average, for example in parts of the Midlands and south-west England.
While we do not yet have a more up-to-date picture nationally, some water companies post updated reservoir levels and current data suggests that reservoir stocks have continued to decline due to high evaporation and increasing water supply demand during the hot July spell, with several water companies issuing messages to encourage customers to use water wisely.
How did we get here?
The current Hydrological Summary shows that current low river flows and groundwater levels reflect a period of long-term dryness, with many areas of the country receiving below average rainfall since October.
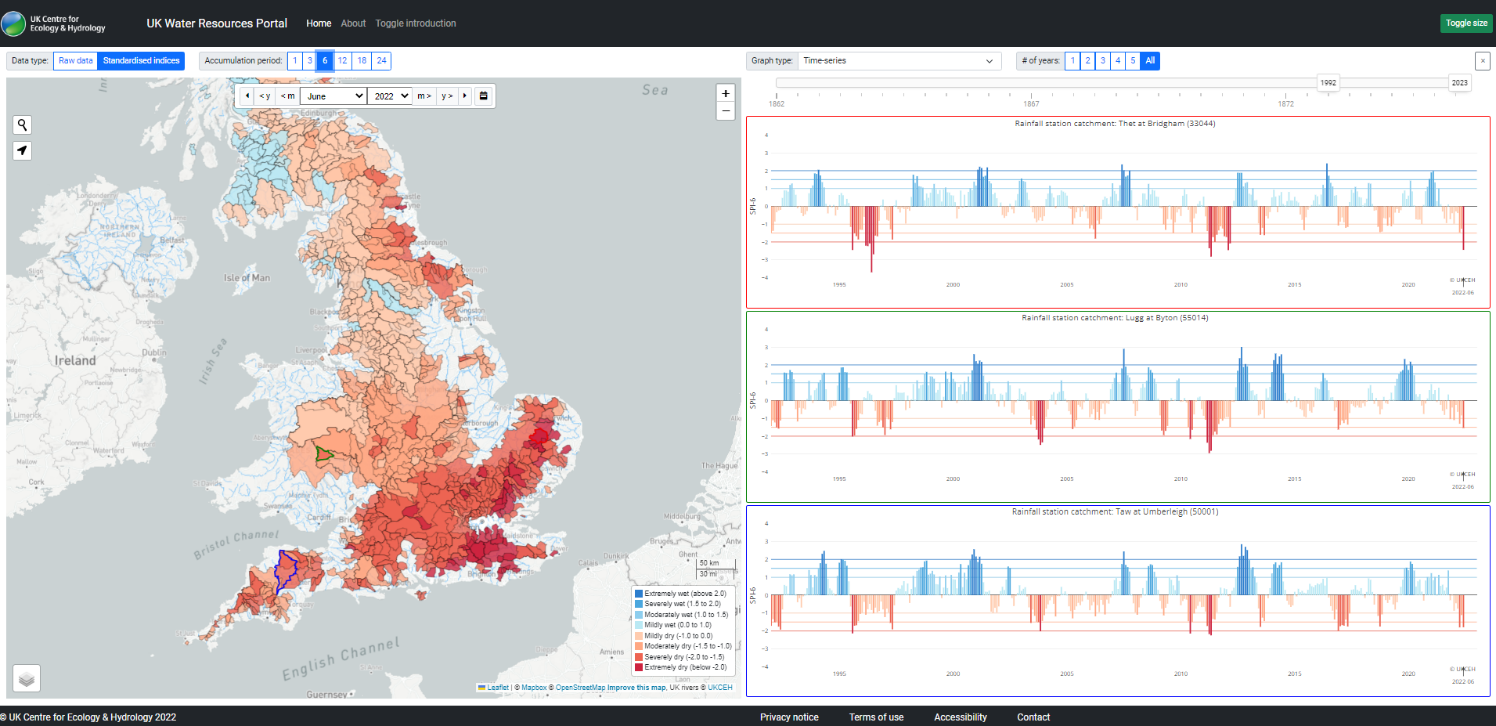
The rainfall deficits can also be explored in the UK Water Resources Portal using a widely-used drought indicator, the Standardised Precipitation Index (SPI), which expresses rainfall anomalies relative to a long-term average for the location and time of year.
The map for the SPI for the six-month period from February to July (SPI-6) shows how ‘severely dry’ or ‘extremely dry’ the situation has been across large parts of southern, central and eastern England and Wales. Time series plots show how this indicator compares to similar anomalies in other drought events like 2018, 2010-2012, 2003 and 1995-1996.
Currently, the SPI for the most recent six-month and three-month periods often approach (and sometimes surpass) the anomalies from these drought events of recent decades – in the example below, the SPI-6 for the Thet in East Anglia is the lowest since the 2010-2012 and 1995-1997 droughts. The very dry start to July means that the month is likely to only extend these anomalies when these indices are next updated in early August.
What is likely to happen next and how can I keep updated?
The prospects for the rest of the summer were highlighted in the July Hydrological Outlook, which projected that for much of the country, below normal flows were likely over the coming months (July-September).
There is much uncertainty in forecasts over this timeframe (especially in summer) and the situation can change rapidly. Obviously, this will largely depend on the rainfall received through the rest of summer, and whether we continue to see high temperatures. Nevertheless, the Hydrological Outlook does point to a likely continuation of below-normal flows and lower groundwater levels, even if we see some wetter weather.
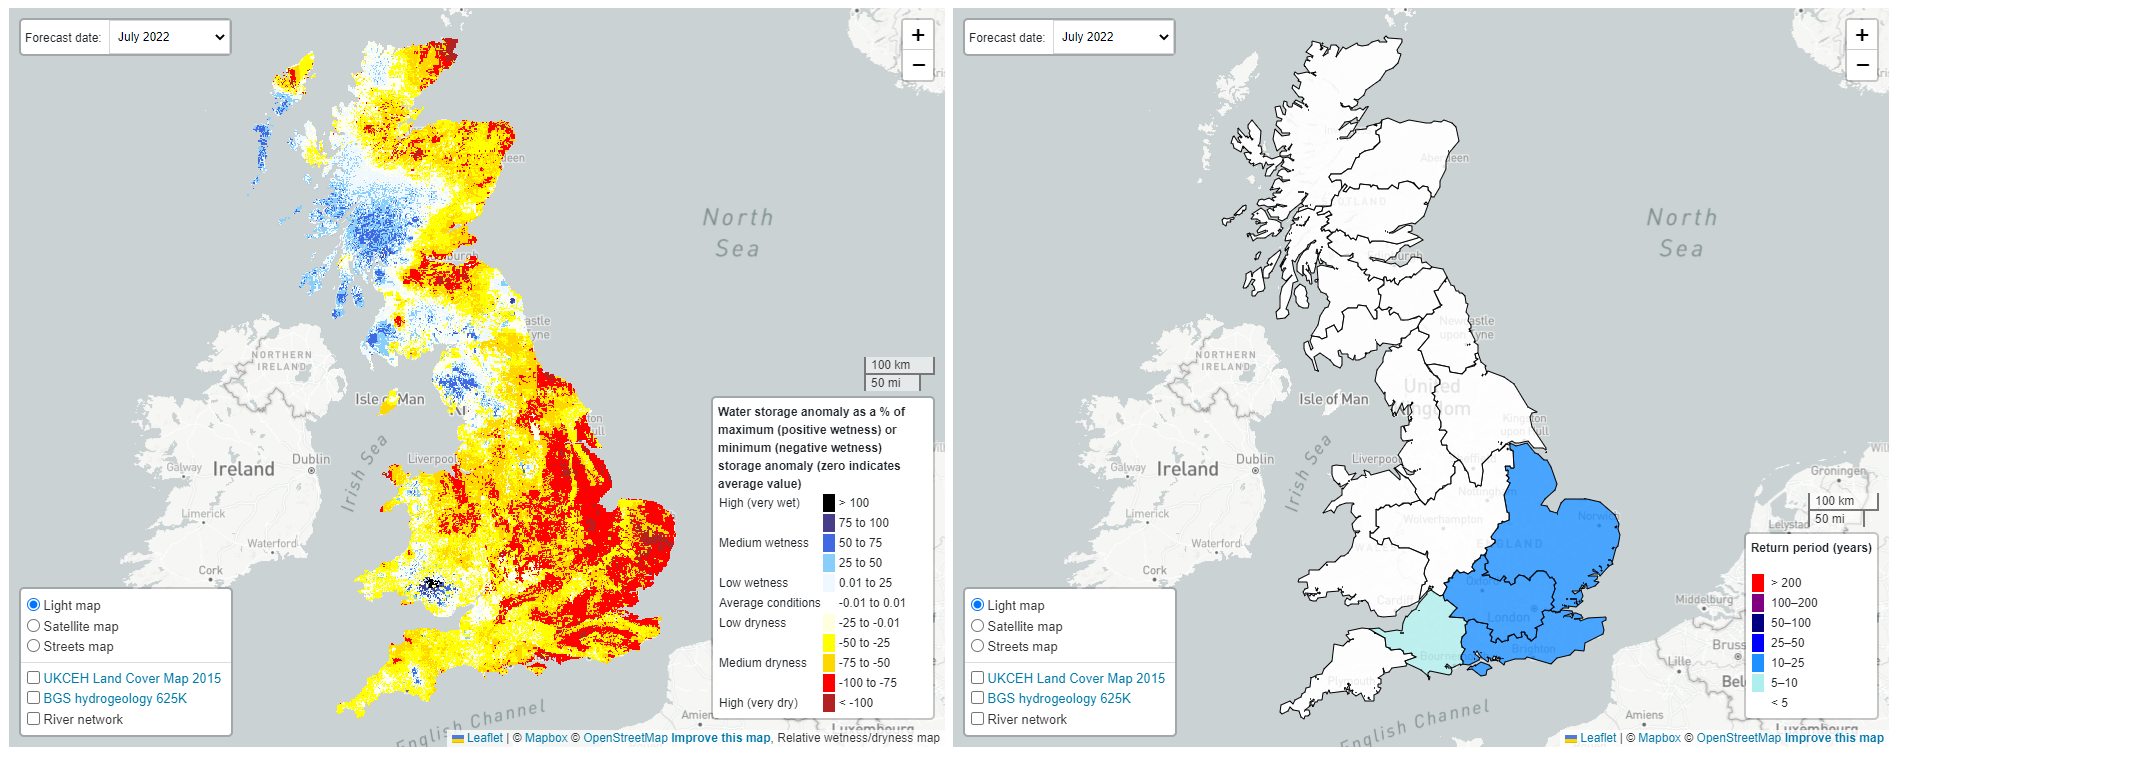
We know that during summer, a large proportion of rainfall is returned to the atmosphere by evaporation, so the ‘effective rainfall’ that reaches rivers and aquifers is lower. Therefore there is likely to be a continuation of below-normal flows unless there is significantly above average rainfall. The wetness and dryness maps on the UK Hydrological Outlooks Portal shown below illustrate that the subsurface (soil and groundwater stores) is so dry in some parts of the country that even very wet summer weather is unlikely to change the situation in the short-term.
In south-east England, even if July was very wet, river flows would be unlikely to be normal or above normal. The July rainfall needed to return to ‘normal’ conditions is exceptional - the equivalent of what would be expected every 10-25 years. As July has been exceptionally dry, so far, in reality, these deficits are likely to have grown further. A repeat of this analysis in early August will give an indication of how likely it is that we will see persistent low flows through the summer.
It should be noted that this only applies in the south and east because of the large subsurface (groundwater) stores in this area. In the north and west, there is less storage and rivers could respond to more modest amounts of summer rainfall, so the situation could change more readily.
We will continue to monitor the situation over the coming months and provide an update in August when the next Hydrological Summary for the UK and UK Hydrological Outlook are published.
In the meantime, our UK Water Resources Portal can be accessed to provide near-real-time updates of the river flow and soil moisture situation.
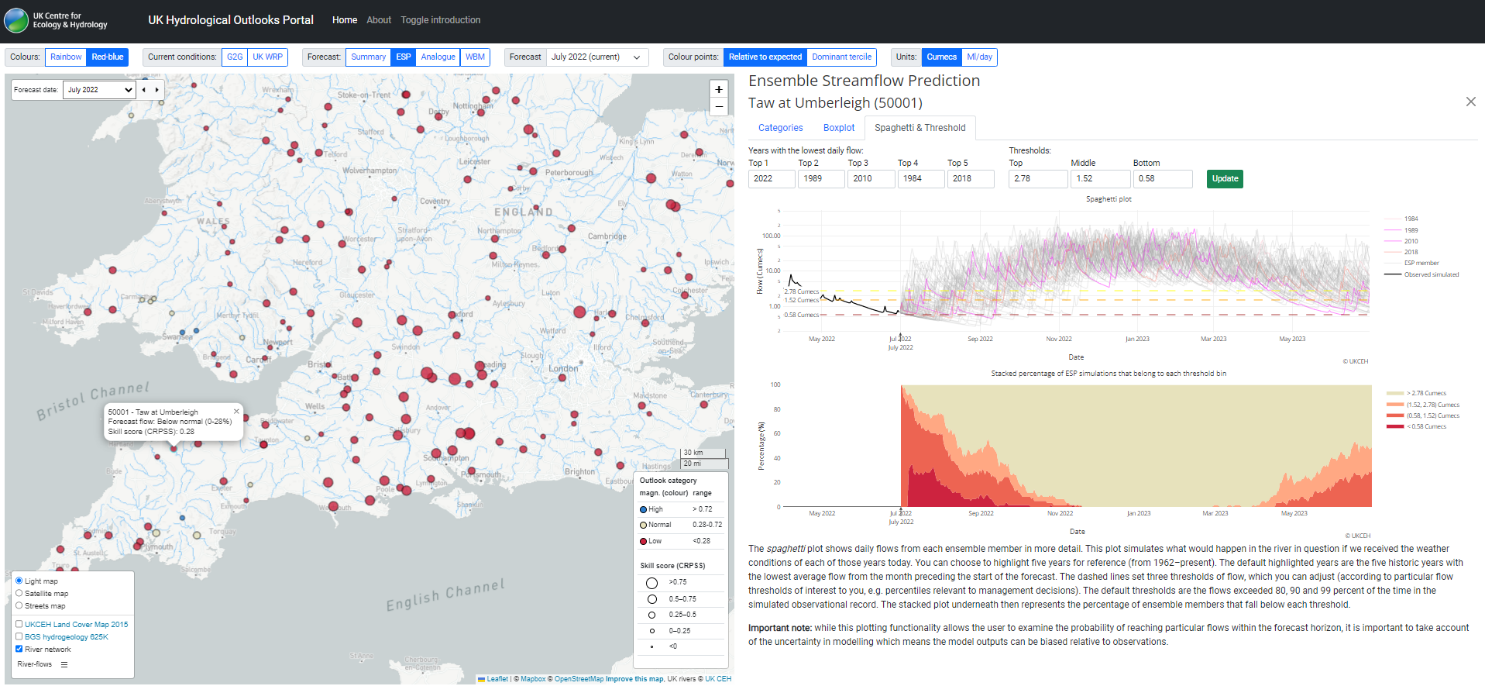
Our new Hydrological Outlooks Portal (which will also be updated early August) shown below has various interactive features, including allowing users to explore catchment-based forecasts that simulate what may happen over the coming months if we have a repeat of weather from previous years (including notable drought years). It also shows the likelihood of reaching any given threshold of river flow; for example, a flow level relevant for water management such as one associated with restrictions on water abstraction.
With contributions from: Lucy Barker, Alannah Killeen, Gemma Nash, Maliko Tanguy, Stephen Turner, John Bloomfield (BGS).