Explore our range of web-based apps and tools which provide methods to search and evaluate different data or support decision-making relating to specific environmental challenges. We also have a range of mobile apps which allow volunteers to submit biological records.
Biodiversity
- Find your niche
The app allows the user to graphically explore and then evaluate the modelled niche of around 1500 plants found in Britain. - Identification of Taxa & Environment Responses (ID-TaxER)
ID-TaxER provides an interface to explore potential soil habitat preferences of bacterial taxa derived from 16S rRNA gene sequencing. Read the associated paper. - Plant diversity and occurrence over 40 years: Trends in plants that impact people and their livelihoods in Great Britain
This app presents changes over time in plant species that are important to a variety of different ecosystem functions, as measured by the Countryside Survey from 1978 to the present. - Targeting Revisits Maps: Craneflies
Supporting biological recording of craneflies in the UK by highlighting 1km squares that are targets for revisits. - Targeting Revisits Maps: Grasshoppers
Supporting biological recording of grasshoppers in the UK by highlighting 1km squares that are targets for revisits. - Targeting Revisits Maps: Ground Beetles
Supporting biological recording of ground beetles in the UK by highlighting 1km squares that are targets for revisits. - Targeting Revisits Maps: Ladybirds
Supporting biological recording of ladybirds in the UK by highlighting 1km squares that are targets for revisits. - Targeting Revisits Maps: Soldierflies
Supporting biological recording of soldierflies in the UK by highlighting 1km squares that are targets for revisits. - What's flying tonight
This app shows a list of moth species that are likely to be seen on any night of the year, anywhere in the UK. This app is used by moth recorders across the UK to help with species identification.
Image

Clean air
- APIS & APIENs Mapping Interface
An innovative one-stop GIS tool for the APIS website. This mapping tool allows users to easily interrogate complex spatial data and find information about protected sites within the four UK countries. This tool helps UK conservation and regulatory agencies and environmental Consultants, to help make decisions on reducing air pollution impacts on protected habitats. - Ammonia Capture using Trees
This tool is a calculator and guidance for farmers, planners and tree planters, so they can maximize the benefits of planting tree shelterbelts for ammonia recapture. This includes information on a number of important aspects of planting, such as recommended planting distances and configurations, species which are better at ammonia capture and other aspects of design so that new planting for this purpose can optimize potential benefits and units located near existing woodland can be situated to capitalize on potential benefits. It also includes prevailing wind and planting suitability maps. - Chamber uncertainty
Characterisation of analytical uncertainty in chamber soil flux measurements - SCAIL Sweden
Simple Calculation of Atmospheric Impact Limits is a suite of screening tools for assessing the impact from agricultural and combustion sources on protected sites in Sweden. Output from the models can then be used to assess whether impact limits for the habitat are exceeded or not.
Climate and land
-
Linking Natural Capital Attribute Groups to Ecosystem Services (LiNCAGES)
LiNCAGES is designed to advise stakeholders on which aspects of their natural capital are most important for supplying the services they value under their chosen context, using evidence from a systematic search of 780 relevant peer-reviewed journal articles. It can also provide a resource for researchers to identify key gaps in this evidence base.
Flood and drought impacts
- Assessing drought risk to vegetation carbon
This visualises an open source approach to assessing drought risk to vegetation at regional-to-continental spatial scale. See more detail in the accompanying story map. - NRFA Trend Explorer
A portal to explore trends in river flow in the UK directly from the NRFA API, looking at both peak flow and daily mean flow.
Soil health
Image
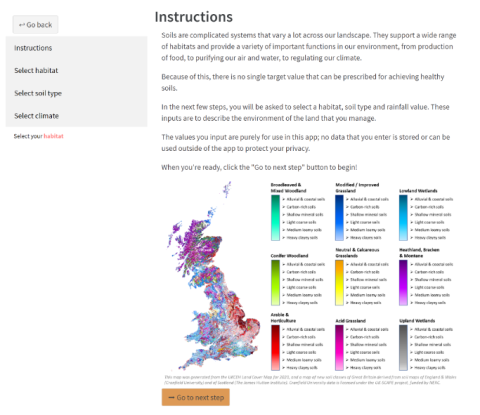
- UKCEH Countryside Survey Soil Health Tool: SOil funDamentals (SOD)
A web tool to help all landowners in Great Britain to monitor and improve the health of their soil.