By combining information on cropping patterns from UKCEH Land Cover® plus: Crops with national survey data on pesticide and fertiliser use, the UK Centre for Ecology & Hydrology created data products UKCEH Land Cover® plus Pesticides and UKCEH Land Cover® plus Fertilisers.
UKCEH Land Cover plus: Pesticides is produced in three time slices (2012-14, 2016-2018 and 2020-2022) for England, Scotland and Wales. UKCEH Land Cover plus: Fertilisers is available as a snapshot average for 2010-2015 and as annual maps for 2015-2021, both for England only. Both maps estimate the amount of agrochemical (pesticide or fertiliser) applied per 1km per year, offering unique datasets of application rates at a fine resolution and national extent.
These maps were developed to aid UKCEH research into the environmental impacts of agriculture and to help develop sustainable farming solutions.
For academic research/education only, these maps are available free to users of EDINA, specifically the Environment section.
UKCEH Land Cover® plus Pesticides
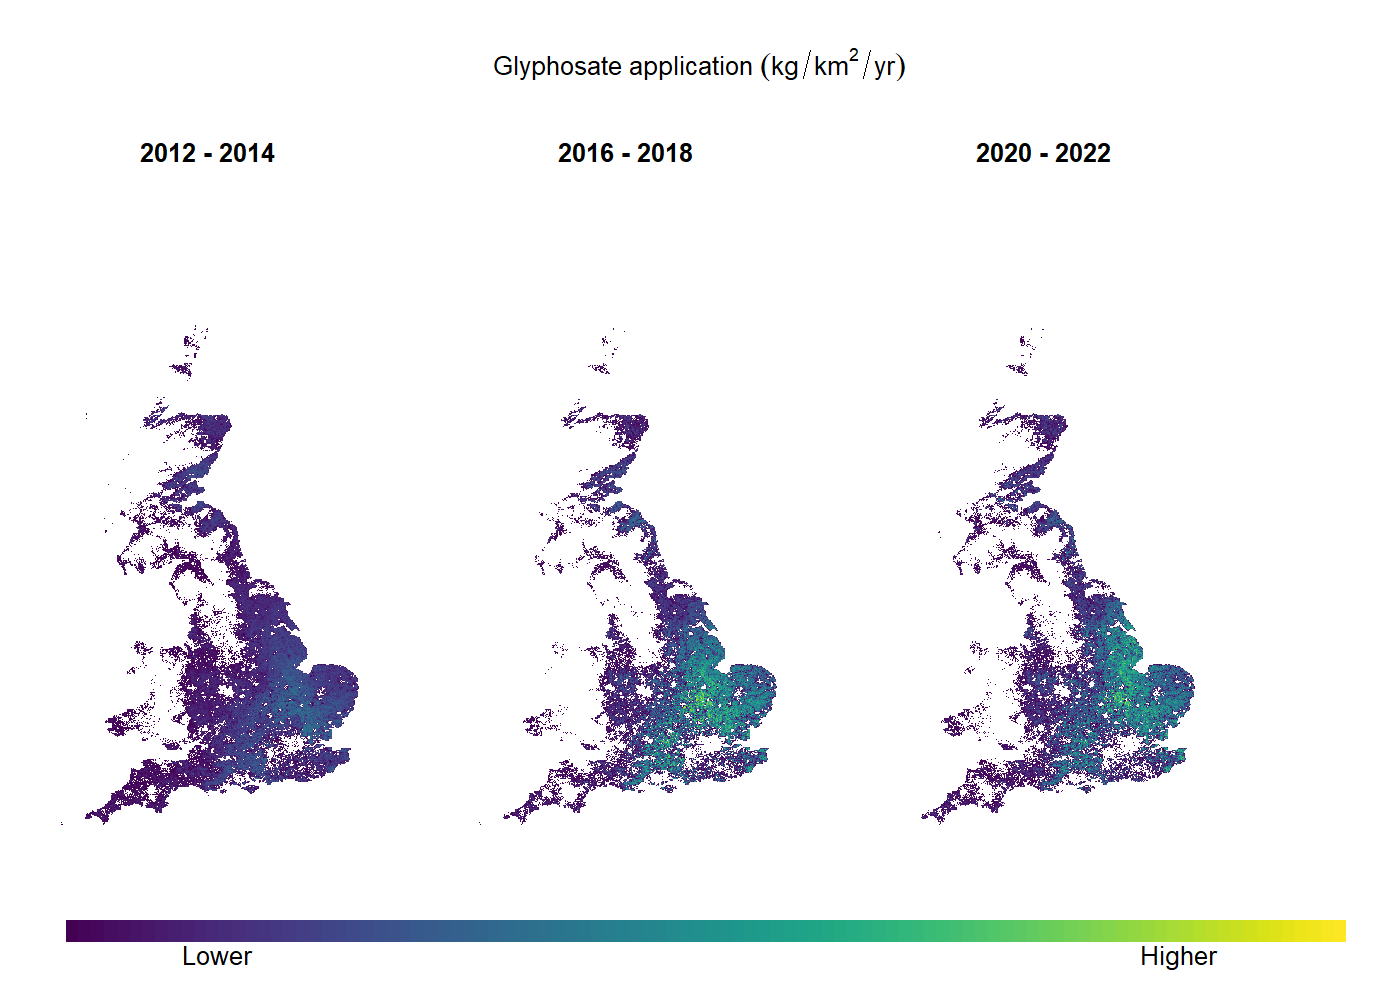
UKCEH Land Cover® plus Pesticides combines UKCEH Land Cover® plus: Crop maps with Pesticide Utilisation Survey data to map average, annual pesticide applications across England, Wales and Scotland at a 1km resolution for 183 active ingredients. Estimates are produced as annual averages for three time periods – 2012-2014, 2016-2018 and 2020-2022 allowing changes in pesticide applications to be tracked over both space and time.
Technical features
- Scale: 1km resolution
- Units: kg of active ingredient / 1km2/year
- Supply Format: GeoTIFF
- Coverage: England, Wales and Scotland
- Period: Three time periods - 2012-14, 2016-18 and 2020-22
- Ingredients: Data are available for 183 active ingredients, although not every ingredient is mapped for every time period
Method
County-level data from the Pesticide Usage Survey (2012-2022) was extracted for each of the three time periods for each crop from the arable and fodder and forage surveys.
Observed application rates for each active ingredient were modelled as a function of the crop to which they are applied and their location.
Using this model, estimated application rates were produced for each 1km square in England, Wales and Scotland using information on the crops grown from UKCEH Land Cover® plus: Crop maps (2015-2022). Hence, pesticide application was mapped even for counties where data was missing for some years on some crops. Cropping information for the earliest time period (2012-2014) was estimated by back casting from the 2015-2022 cropping data.
Uncertainty maps are presented alongside each active ingredient map to quantify the level of confidence in the estimated application rates.
Potential Uses
- Detecting the impact of pesticide use on wildlife population trends.
- Prediction of the environmental fate of active ingredients and exposure risk to key groups (e.g. pollinating insects).
- Modelling agrochemical runoff.
- Water quality management in support of the Water Framework Directive.
- Targeting management interventions such as pesticide stewardship.
- Wider monitoring of pesticide use across landscapes in support of improved regulation.
UKCEH Land Cover® plus Fertilisers 2010-2015 (England)
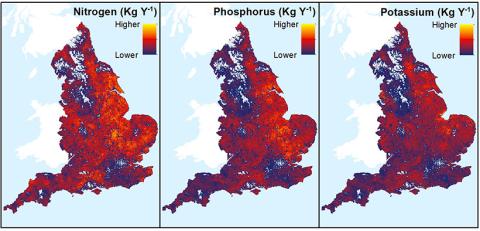
UKCEH Land Cover® plus Fertilisers 2010-2015 maps estimate average, total, annual, application of manufactured Nitrogen, Phosphorus and Potassium.
Technical features
- Scale: 1 km resolution
- Units: kg of Nitrogen, Phosphorus and Potassium / 1km2
- Supply Format: GeoTIFF
- Coverage: England
- Period: A snapshot of average total annual applications between 2010 and 2015
Method
Anomysed data from the Defra and Scottish Government sponsored British Survey of Fertiliser Practice (2010-2015) was used to derive average, total, annual application of manufactured fertilisers for each crop type per survey location.
A spatial interpolation model was used to predict applications from every 1km grid cell in England.
The total application of each 1km square was then derived using crop areas from UKCEH Land Cover® plus: Crops (averaged 2015-2017).
Uncertainty maps are presented alongside the fertiliser application maps to quantify the level of confidence in estimated application rates.
Potential Uses
- Prediction of environmental impacts, such as modelling agrochemical runoff, eutrophication and soil health.
- Planning and environmental protection, such as catchment sensitive farming and estimates of gaseous emissions.
- Supporting the agricultural industry, providing data on patterns of crop inputs.
UKCEH Land Cover® plus Fertilisers 2015-2021 (England)
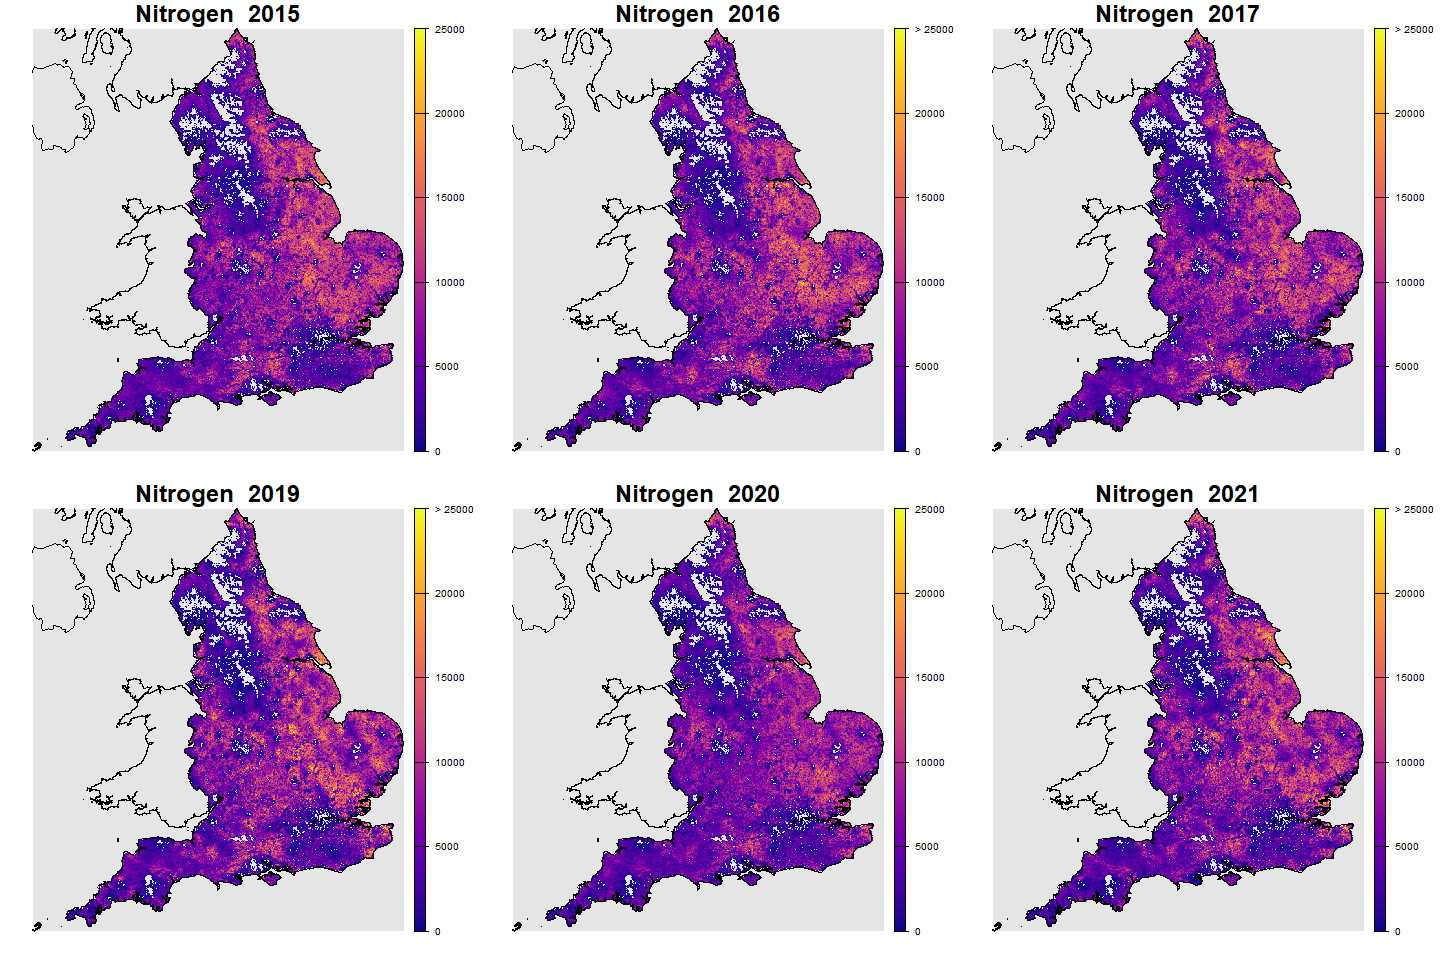
UKCEH Land Cover plus: Fertilisers 2015-2021 maps estimate total, annual, application of manufactured Nitrogen, Phosphorus and Potassium. The product builds on the previous UKCEH Land Cover plus: Fertilisers 2010-2015, covering more recent years, and increasing the temporal resolution to provide a map per year instead of an average across years.
Technical features
- Scale: 1km resolution
- Units: kg of Nitrogen, Phosphorus and Potassium / 1km2 / year
- Supply Format: TIFF
- Spatial extent: England
- Period: An average total annual application for each year between 2015 and 2021
Method
Data on fertiliser applications were derived from the Defra British Survey of Fertiliser Practice (BSFP). To produce a map of applications across England, UKCEH Land Cover plus: Crops was used to identify which crops were grown where, and the modelled fertiliser applications to each crop in each 1km square were summed to create an estimate of total fertiliser application rates per 1km square (kg/km2/yr).