Lake ecosystems are continually changing. Consistently collected, long-term data provides the evidence we need to detect and understand these changes. Lakes in the Windermere catchment in Cumbria, England have been monitored intensively for many decades, providing a rich source of such evidence.
Here Dr Steve Thackeray and Dr Ellie Mackay discuss comparisons between recent (2017-2021) with historic (1981-2010) data collected from four lakes in the catchment: the north and south basins of Windermere, Esthwaite Water and Blelham Tarn. They focus on four characteristics (surface water temperature, oxygen concentration, dissolved phosphorus and algal biomass) that give an indication of physical, chemical and biological change in lakes.
In summary
- Scientists have been collecting information on the water quality and state of lakes in the Windermere catchment for decades.
- Since the 1980s, there has been clear evidence of the impacts of climate warming, such as higher surface water temperatures during the spring and early summer.
- However, dissolved phosphorus concentrations, affected by inputs from sewage, agricultural runoff, and potentially lake sediments have declined over the long term.
- On average, changes in patterns of algal growth because of these influences, have been subtle.
Background
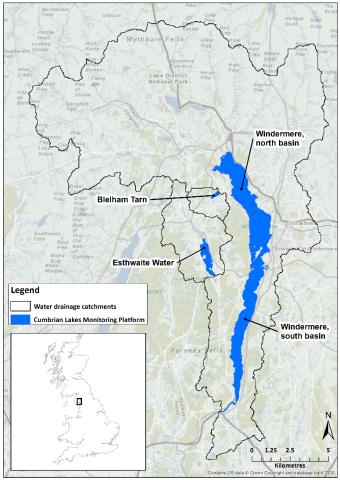
Figure 1: Location of the Cumbrian Lakes
Monitoring Platform long-term lakes
monitoring sites, in the Windermere catchment
Freshwater ecosystems such as lakes and rivers are hotspots for biodiversity and provide people with diverse benefits, including water for drinking and agriculture, recreational opportunities, wellbeing, cultural connections, and inspiration. At the same time, these ecosystems are being heavily impacted by multiple threats, like pollution, land use change, species introduction, and climate change. These human-induced stressors threaten plant and animal life, the functioning of ecosystems, and ultimately the delivery of benefits to society.
As such, there is an urgent need to understand these impacts if we are to mitigate against, and adapt to, ecological change. Like all the world's freshwater ecosystems, the Cumbrian Lakes are in a continuous state of change, over hours, days, months, years, decades, and centuries. To fully understand the current state of these ecosystems, we must consider their longer-term history. Only then will we know whether the conditions of the last few years are exceptional or, in fact, within the range of historic variability. This is only possible if we have access to sustained ecosystem monitoring data, collected over the long term using consistent methods.
These long-term records of ecosystem change are globally very rare and increasingly threatened by funding cuts. However, we are very fortunate that such data exist for the lakes of the Windermere catchment: Blelham Tarn, Esthwaite Water, and the north and south basins of Windermere itself (Figure 1).
The long-term monitoring of these iconic lakes was initiated by the Freshwater Biological Association in the 1940s and, since the late 1980s, has been continued by what is now the UK Centre for Ecology & Hydrology. Most recently, the work has been supported by the UK-SCAPE national capability programme, funded by the Natural Environment Research Council. Here, we use the exceptional long-term records generated by this effort to compare conditions in the most recent five-year period (2017-2021) to a historical baseline of 1981–2010; a 30-year time period often used in climate reporting. We focus our comparisons on selected "indicator variables" that collectively give an indication of physical, chemical and biological change.
How have the Cumbrian Lakes changed?
Below, we illustrate long-term changes in our selected indicator variables: surface water temperature, bottom water oxygen concentration, dissolved phosphorus concentration, and "algal" biomass. These indicators have been chosen to represent different aspects of a lake’s condition: physical, chemical and biological, which provide us with a picture of the lake ecosystem. For each of these variables, we present a panel-of-four images which includes data from each of the four monitored lake basins. For each lake, we provide an average (mean) value for the indicator in question, for both the recent and baseline time periods. In addition, we plot the average monthly values of each indicator in both time periods, to show how they change through the year. For the baseline period, these monthly averages are presented within an "envelope" that indicates the among-year variability of the data, for each month of the year (based upon a measure of variability called a standard deviation). This allows us to see the extent to which recent lake conditions are within the range of historic variability.
| Box 1: Thermal stratification |
|---|
|
Increases in solar radiation and air temperature, during the spring and summer, cause surface water temperatures to increase and for those waters to become less dense. At the same time, deep waters, where the surface heat doesn't reach, typically remain cool and denser. The result is that a layer of warm surface water forms on top of a layer of cooler deep water. This effect limits mixing between the layers. We call this phenomenon thermal stratification. |
Surface water temperature
Water temperature is a critically important property of the lake environment. Most freshwater species are ectothermic (meaning that their body temperature is determined by the temperature of the external environment), and the rates at which these organisms grow, develop and reproduce will depend upon how warm the water is. In addition, water temperature affects the water density, and therefore the physical structure of the lake water column (see Box 1 above). Furthermore, water temperature determines the solubility of oxygen and, as such, changes in temperature could affect how much oxygen is available to freshwater organisms. Importantly, water temperature provides us with an indicator of ongoing climate change.
What’s happened to surface water temperature in the lakes?
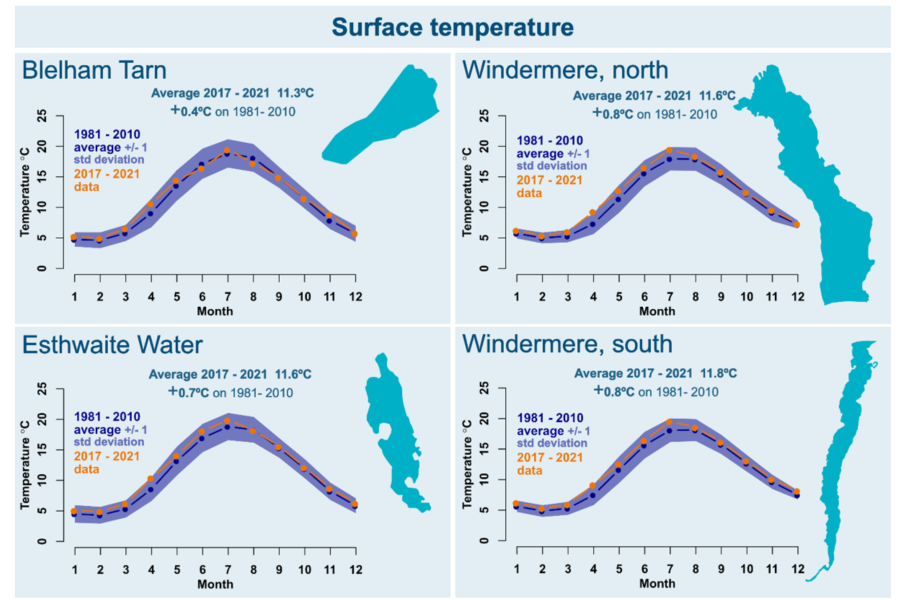
The annual average surface water temperature across all lakes was around 11.5°C in the most recent five-year monitoring period. In all cases this represents an increase on the 30-year time period (1981–2010) of between 0.4 and 0.8°C. Across the lakes, temperatures are typically at a minimum during the late winter in February, before warming during the spring and summer to a peak in July for the smaller lakes, Blelham Tarn and Esthwaite Water, or in July and August for the Windermere basins. Following this, surface waters cool over the late summer and autumn, and into the wintertime.
By comparing the most recent five years with the historical baseline, we can see that long-term warming is most apparent during the spring and summer months, particularly from April to July.
Bottom water oxygen concentration
Oxygen concentrations are of critical importance in determining habitat quality for most underwater wildlife, which require oxygen to ‘breathe’ through cell walls, skin or gills. Organisms will be unable to survive in, and will be excluded from, areas where oxygen concentrations fall to very low levels. In temperate, stratifying lakes (see Box 1 above), oxygen concentrations can decline in deep waters over the course of the spring and summer, when they will be at a minimum. This happens when microorganisms in deep waters use oxygen during their decomposition of organic materials that “rain down” from the surface waters and oxygen cannot be replaced due to inhibited water mixing.
An important implication of this drop in oxygen is that it can alter the chemistry of sediments in such a way that nutrients (phosphorus and nitrogen) are released back into the water, potentially fueling "algal" growth. Understanding changes to the minimum oxygen concentration, expressed here as a percentage of air saturation (equilibrium with air being equal to 100%), therefore enables us to assess how much the deep water in the lake is being depleted during the year.
What’s happened to deep water oxygen in the lakes?
The average minimum oxygen saturation for 2017–2021, measured in deep waters, varies across the lakes from 42% in Blelham Tarn to 66% in Windermere, north basin. All lakes have experienced a decline in minimum oxygen saturation over time, with the smallest decline occurring in Esthwaite Water, 0.5%, and the largest decline occurring in Windermere, north basin, 9.1%, compared to the historic 30-year average.
The smaller declines in the Esthwaite Water and Blelham Tarn reflect the fact that in both the historic and recent data, the bottom waters were anoxic, without any oxygen, for several months of the year in the summer and therefore oxygen levels cannot decline further. The seasonal patterns of decline in oxygen from April, until the lakes begin to mix in October and November, reflect the seasonal summer stratification period.

For Esthwaite Water and Blelham Tarn, the most recent data falls within the variability of the historic data. In Windermere, this pattern is slightly different. The south basin of the lake experienced a seasonal decline in oxygen concentrations in both the historic and recent time periods, but the decline appears slightly more pronounced in the recent time period, during the spring. In Windermere north basin the decline in the minimum oxygen concentration is much more pronounced during the recent time period than during the baseline period, throughout much of the year, particularly during the summer and autumn, before the lake mixes in December.
Dissolved phosphorus concentrations
Phosphorus is a key nutrient that, when in short supply, can control (or "limit") how much "algae" and aquatic plants can grow. The phosphorus that is dissolved in lake water, rather than attached to particles, is easily accessed by these organisms to fuel growth. Dissolved phosphorus enters lakes from the surrounding catchment, primarily from sewage and agricultural runoff. It can also be supplied to the lake “internally” from lake sediments when deep water oxygen concentrations fall to very low levels.
What’s happened to dissolved phosphorus in the lakes?
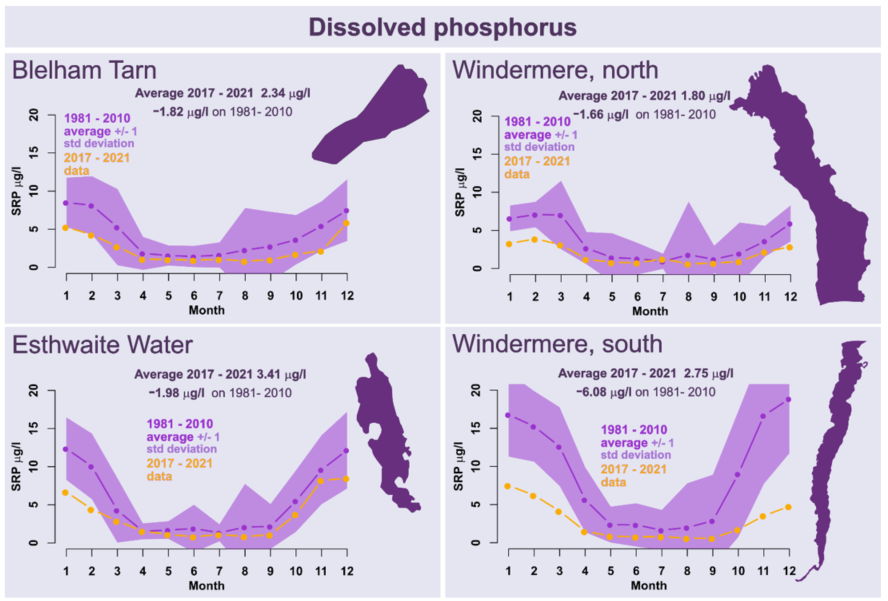
Dissolved phosphorus concentrations in the lakes are relatively low, when we consider that around 3 µg/l is a level that can limit algal growth. Annual average concentrations from the most recent five years range between 1.8 µg/l in Windermere, north basin and 3.4 µg/l in Esthwaite Water. This represents a decline at all sites compared to the historical 30-year average (1981–2010), and this decline is particularly distinct during the winter. Dissolved phosphorus in these lakes follows a clear seasonal pattern, with peak concentrations occurring in the winter and minimum concentrations through the spring and summer. This happens because algae and plants use more of the available nutrients during the growing season than during the winter period, when other factors such as light availability and temperature restrict growth.
"Algal" biomass
We often refer to "algae" as being at the base of the lake food chain, or more correctly food web. However, this community of photosynthesising microorganisms contains not just algae, but also a group of bacteria, the cyanobacteria, that are capable of photosynthesis. It is these cyanobacteria, often referred to as “blue-green algae”, that can be observed as inshore “scums” under calm weather conditions. One way of measuring the overall amount or biomass of algae and cyanobacteria is to analyse the concentration of the photosynthetic pigment chlorophyll-a in lake water. This pigment provides us with a convenient proxy for the overall biomass of algae and cyanobacteria in the lake.
What’s happened to algal biomass in the lakes?
The annual average chlorophyll-a concentrations for the most recent five years suggest that both Windermere basins are mesotrophic (moderately productive), with chlorophyll-a concentrations of 6.0 and 7.5 µg/l for the north and south basin, respectively. In contrast, Blelham Tarn and Esthwaite Water are eutrophic (highly productive), with concentrations of 13.6 µg/l and 20.8 µg/l, respectively.
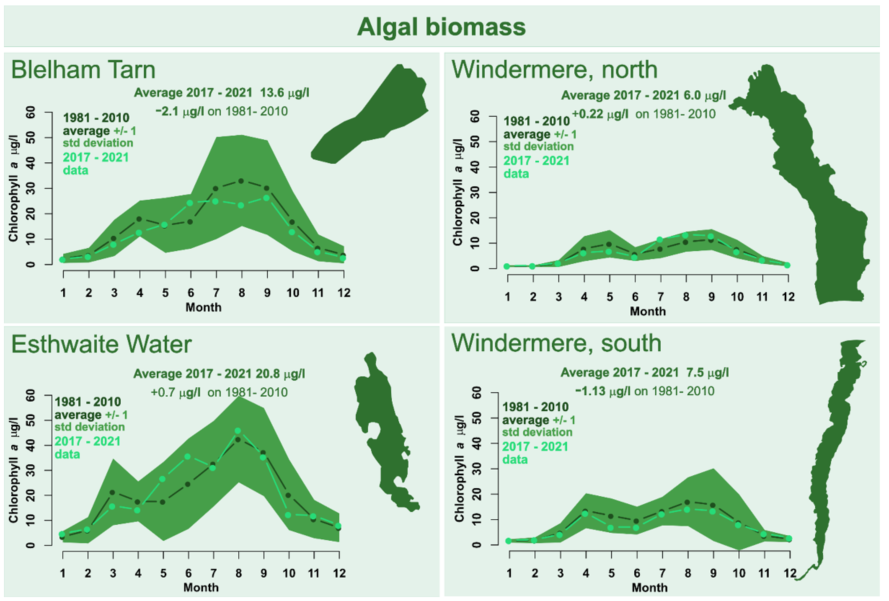
The recent annual average algal biomass has increased in both Esthwaite Water and Windermere north basin, but decreased in Blelham Tarn and Windermere south basin, compared to the 30-year baseline average (1981–2010). The seasonal patterns in chlorophyll-a concentration from the historical data show a typical pattern of spring and summer peaks in algal growth. The data from the most recent five-year period reveal how algal growth has changed relative to this historical baseline.
In both Blelham Tarn and Esthwaite Water, the dual peak of the historical data has been replaced by a single summer peak. While that peak is lower than the historical average for Blelham Tarn, there has been an increase in algal biomass in the early summer in Esthwaite Water. In Windermere, both basins retained the spring and summer peaks in algal biomass, and the seasonal pattern in the recent data is like that in the historic data. While there has been a small decrease in biomass between May and September in the south basin, and changes in the relative size of the spring and summer peaks in the north basin, these changes fall largely within the range of historical variation.
In conclusion
- Lake ecosystems are continually changing. Consistently collected, long-term data provides the evidence we need to detect and understand these changes.
- Lakes in the Windermere catchment have been monitored intensively for many decades, providing a rich source of such evidence.
- When comparing recent (2017-2021) with historic (1981-2010) data, we can see that:
- The lakes have warmed during the spring and early summer
- Deep-water oxygen concentrations decline during the spring and summer months, especially in the most productive lakes. There is some evidence that these declines have become more pronounced in Windermere.
- Dissolved phosphorus concentrations are reduced during the growing season, as this nutrient is used by algae and plants. Concentrations have generally declined over the long term.
- The seasonal growth of algae typically shows two peaks, in the spring and summer. This seasonality shows signs of change over the long term, especially in Blelham Tarn and Esthwaite Water, but overall average biomass is similar between time periods.
- As well as long-term, decadal-scale changes there is also great year-to-year variability in the state of the lakes.