trusted models – no specialist software needed – scenario analysis – customisable – any city
Image

CET helps cities to:
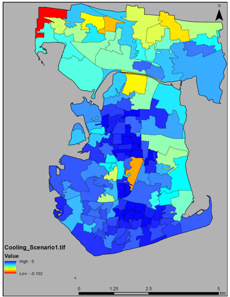
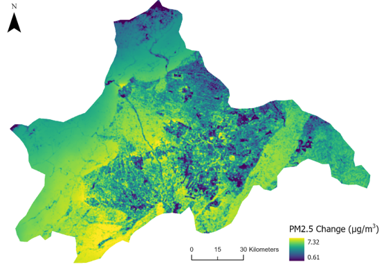
- Plan new urban green/blue space
- Estimate the benefits it provides
- Show opportunity maps of best locations
- Highlight social and demographic equity issues