Regional Differences in Spatiotemporal Drought Characteristics in Great Britain
 Maliko Tanguy1*
  Klaus Haslinger2
  Cecilia Svensson1
  Simon Parry1
  Lucy J. Barker1
  Jamie Hannaford1,3
  Christel Prudhomme4,5
- 1UK Centre for Ecology & Hydrology, Wallingford, United Kingdom
- 2Climate Research Department, Central Institute for Meteorology and Geodynamics (ZAMG), Vienna, Austria
- 3Irish Climate Analysis and Research UnitS (ICARUS), Maynooth University, Maynooth, Ireland
- 4European Centre for Medium-Range Weather Forecasts, Reading, United Kingdom
- 5Laboratory Department of Geography, Loughborough University, Loughborough, United Kingdom
Despite being one of the most damaging natural hazards, droughts and their spatiotemporal dynamics are typically not well understood. Great Britain, which is the focus of this work, has experienced many major drought episodes in the past, causing a range of socioeconomic and environmental impacts. Here, we apply a recently developed technique to identify and characterise past droughts, using space-time connectivity to extract events from a monthly gridded precipitation dataset covering 1862–2015, without imposing fixed geographical boundaries or time-frames. For each grid cell, the data was aggregated into four new time series using moving averages over 3-, 6-, 12- and 24-month windows. These reflect a range of response times for different types of drought impacts. Drought events were then extracted for each time window separately. In order to assess regional differences in drought characteristics, each extracted drought was assigned to one of three regions: the South-East (SE), the North-West (NW) and a “Transition” region in-between them. A frequency analysis of drought characteristics (duration, area, intensity and severity) highlighted differences between regions: for short and medium accumulation periods (3, 6, and 12 months), short and less severe droughts are more frequent in the NW than in the SE, whereas long, spatially extended and more severe droughts are more frequent in the SE than in the NW. However, for long accumulation periods (24 months), fewer differences are observed between the NW and the SE. In the “Transition” region, severe droughts are less frequent than in the other two regions. A timeline of historic drought events detected by our method included the vast majority of known drought events from previous studies, with a few additional ones, and we shed important new light on the relative severity of these historical drought episodes. Finally, an analysis of the spatial coherence between regions showed that the most extreme drought events presented little spatial coherence, whereas less severe droughts tend to be more spatially coherent. This has important implications for water resources planning and drought management strategies, particularly given the increasing emphasis on inter-regional water transfers as a potential solution in situations of extreme drought.
Introduction
Globally, drought is one of the most damaging natural hazards (Blauhut, 2020). Droughts pose a major threat to lives and livelihoods across the world, and the impacts of drought are expected to increase in future on a global scale, due to anthropogenic warming (Prudhomme et al., 2014) and socio-economic changes (Arnell et al., 2019). As such, there is a growing demand for drought and water resources management systems that enable policymakers and practitioners to appraise the risk of drought occurring, under historical conditions as well as using future projections, to identify appropriate adaptation options. In addition, monitoring and early warning systems are needed to help identify the onset, development and recovery from droughts and to identify when appropriate mitigation measures should be applied to avoid impacts on society and the environment (Bachmair et al., 2016).
Such drought management systems rely on a proper understanding of drought occurrence and dynamics in the region in question. A key characteristic of droughts is that they tend to be large-scale phenomena, and typically evolve slowly, at least in comparison to other hazards (a “creeping” hazard, e.g., Wilhite et al. (2014)). In theory, this slow evolution should be an asset to drought managers, particularly for enabling early warning. However, the slow onset can make it challenging to define drought and identify onset of drought conditions (with a similar complexity occurring for drought termination; Parry et al. (2016)). The large spatial scale also presents a problem, as compared with other hazards such as flooding; quantifying drought severity is challenging as risk assessments need to capture duration and intensity, but also spatial extent. Assessment of flood rarity typically proceeds by examining a time series of levels or river discharge measurements at a point, but droughts can extend over hundreds of square kilometres and, moreover, given the often slow evolution of events, these properties all vary over the course of a drought event as the focal point of the event migrates in space (Lloyd-Hughes, 2012).
These properties of droughts call for drought severity assessment methods that explicitly take into account both the spatial and temporal component of drought. There have been many previous efforts to quantify the occurrence of meteorological droughts using spatiotemporal methods. Typically, fixed regions are selected and time series of e.g., rainfall or evaporative demand are analysed (e.g., van der Schrier et al., 2007; Spinoni et al., 2015). Other authors have analysed space and time in parallel using Severity-Area-Duration (SAD) methods (e.g., Andreadis et al., 2005; Sheffield et al., 2009) which quantifies droughts in terms of prescribed areas and durations. However, this does not allow temporal dynamics to be fully resolved – i.e., the method allows long-term statistics of drought severity and areal extent to be characterised, but does not allow events in time to be extracted, nor the analysis of trends over time. To this end, Lloyd-Hughes (2012) proposed a three-dimensional structure-based approach which quantifies the space-time evolution of droughts without reference to fixed regions. This allows the structure of individual events to be characterised as they evolve through space and in time. However, this method is primarily aimed at comparing the similarity in structure of such “extracted” drought events, and is less well suited to examining drought occurrence or historical evolution. Haslinger and Blöschl (2017), on the other hand, propose a new method of space-time evolution that enables extraction of drought event characteristics in terms of duration, severity and intensity, but also spatial extent – enabling return periods to be ascribed to these characteristics.
This work focuses on the United Kingdom, a comparatively wet country but one which is known to experience major meteorological drought episodes that have caused severe impacts on hydrology, water resources, the environment and society (Marsh et al., 2007; Barker et al., 2019). The climatology of meteorological droughts, in terms of duration, severity, etc. has been studied extensively in the past. However, this has typically been done for fixed pre-defined regions (Burke and Brown, 2010; Hannaford et al., 2011). The spatial coherence of drought has been documented without recourse to fixed regions, using high-resolution gridded precipitation datasets by Rahiz and New (2012) and Burke et al. (2010). However, while the former examined spatial coherence across the United Kingdom – quantifying how correlation between grid points decays with distance, and how this varies regionally and seasonally – it did not consider temporal dynamics, being focused on long-term drought statistics. The latter was focused primarily on providing a baseline for future climate change experiments, and did not analyse past drought characteristics or dynamics in detail. Furthermore, most studies have examined meteorological drought risk using relatively short records, although Rahiz and New (2012) and Burke et al. (2010) considered a gridded dataset available back to 1914 (but the density of gauges in the early period is low).
In summary, there have not been detailed studies of United Kingdom meteorological droughts that quantify the frequency of droughts in terms of their duration and intensity in parallel, using methods that enable droughts to be quantified from a spatiotemporal angle that dispense with fixed regions. Here, we aim to close this research gap by using the drought extraction method of Haslinger and Blöschl (2017) to a newly available gridded precipitation dataset extending back to 1862, which includes a wealth of newly digitised data to enhance the spatial coverage of the early period (MetOffice, 2019, 2020). The regional differences in these spatiotemporally extracted droughts are then analysed to better understand the physical and natural contrast in drought dynamics across Great Britain.
This work is necessary to provide a full understanding of meteorological drought occurrence, enabling water managers in the United Kingdom to undertake more informed drought risk assessments to support drought and water resource planning. Following recent policy changes, specifically the “duty of resilience” in the WaterAct, 2014 (WaterAct, 2014), United Kingdom water managers need to plan for droughts worse than those experienced in the historical record. This has prompted a widespread uptake of stochastic simulation to appraise drought frequency and severity, but this has often been done in different ways at different scales by the United Kingdom’s many private water companies. There are growing calls for a nationally consistent dataset of spatially coherent droughts to support intra-regional planning and adaptation (Environment Agency, 2020). To support this, studies of drought space-time coherence as well as regional drought occurrence are needed. So far, most applied efforts have focused on specific regions for a very limited number of individual gauges with comparatively short records (e.g., WaterUK, 2016). Here, we provide a more comprehensive appraisal of meteorological drought risk at a national scale, using a long-term high-resolution precipitation dataset. We acknowledge that water resources planners also need to understand hydrological and water supply system drought risk. At present, this is done in a myriad different ways in different regions of the United Kingdom and different water supply systems. In the present paper our focus is on the meteorological inputs, which are of fundamental importance to all planners (as well as those non-statutory water users outside the water industry who are also concerned with drought), and are ultimately the primary input to hydrology/supply models. Furthermore, when considering meteorological drought there is an available high-resolution, gridded and spatially complete dataset extending back to 1862, which is not possible for hydrological variables. However, to reflect the different response times for different types of drought impacts, such as agricultural, hydrological and groundwater impacts, we aggregate the precipitation data into four new datasets, by applying moving averages over 3-, 6-, 12- and 24-month windows.
Specifically, four main research questions were addressed in this study:
(i) Where in Great Britain (GB) do droughts occur more frequently over the historical period?
(ii) How do the drought characteristics differ in different regions of GB in terms of area, duration, intensity and severity?
(iii) When and where did major droughts occur in the past?
(iv) How much spatial coherence of droughts is there between regions? In other words, does drought occur simultaneously in different regions of GB?
Data and Methods
Section “Data and Methods” presents the precipitation dataset used for the analysis, and the methods applied (i) to identify the drought events, (ii) to define the geographical regions considered, (iii) to assign the identified drought events to the geographical regions, and (iv) to estimate the frequency of occurrence of events with respect to their spatial extent, duration, intensity and severity.
Data
The monthly GB precipitation dataset used in this study was derived by the United Kingdom Met Office as a result of a large data rescue and digitisation programme, carried out within the Historic Droughts project1. The 5 km gridded dataset, which covers the period 1862 to 2015, was derived using the same methodology as the UKCP09 data (MetOffice et al., 2017), with interpolation carried out using inverse distance weighting (Perry and Hollis, 2005). The value of each pixel corresponds to the precipitation at the centre of the cell.
The Met Office has invested a great amount of effort to rescue data and digitise precipitation data back to the second half of 19th century within the Historic Droughts project. This has substantially increased the density of the monthly raingauge network in the earlier period (1862–1910) compared with the raingauge density used to derive other datasets such as the CEH-GEAR (Keller et al., 2015; Tanguy et al., 2019) rainfall datasets. The data rescue and digitisation programme added over 200 monthly gauges to the network for the period 1862 to 1910 (MetOffice, 2019, 2020). However, reliability of the data, particularly for the earlier period, needs to be carefully considered, and this is being discussed in Section “Uncertainties in the Data” of the Discussion.
Identification of Drought Events
For the identification of drought events, the method developed by Haslinger and Blöschl (2017) was applied using the historic precipitation data. This method was first developed to investigate the historic spatiotemporal drought characteristics in the Greater Alpine region of Central Europe. The method consists in, firstly, calculating moving averages of monthly precipitation data for different accumulation periods (3, 6, 12, and 24 months) on every grid point in the domain. The different accumulation periods are useful for examining different types of drought; for example, short precipitation accumulation periods often reflect the response of river flows, and longer accumulations the response of groundwater, or groundwater dominated river flows (Barker et al., 2016). The longer accumulation periods are also of interest for reservoir levels and water resources planning, although in some areas such as the north-west of England, the 3-month accumulation period can also be relevant for reservoirs (e.g., in summer 2018, Parry et al. (2018)).
A Gamma distribution is then fitted to the averaged precipitation, separately for every month of the year and every grid point, in a similar way as in the Standardised Precipitation Index (SPI) (McKee et al., 1993). To separate dry from non-dry areas, a quantile value equal to 0.2 (i.e., corresponding to a non-exceedance probability of 0.2) was used as a threshold. Although this is not a very extreme value (equivalent to a 5 year return period, and an SPI−value of −0.84), it was initially proposed by Agnew (2000) as a threshold to define moderate droughts, and is commonly used to identify dry precipitation anomalies (e.g., Vicente-Serrano, 2006, 2007; Livada and Assimakopoulos, 2007; Santos et al., 2011; Ribeiro et al., 2020). For a more intuitive assessment of drought intensity, these non-exceedance probabilities are scaled in order to get higher values with higher drought intensity using the equation:
where the new scaled quantity, qint, will be referred to as the quantile drought intensity, p is the probability of non-exceedance of the observation, and ξ is the 0.2 threshold. The intensity measure qint ranges between -4 (probability of non-exceedance of 1) representing the wettest conditions and 1 (probability of non-exceedance of 0) representing the most severe drought of a particular location and month.
Lastly, once qint is calculated for every grid point and every month, the algorithm detects contiguous areas with drought intensity values qint larger than 0. The drought area (DA) detected in this way for this time step is compared with the DA of the next time step. If they overlap in space, they are considered as belonging to the same drought event. The same three criteria defined in Haslinger and Blöschl (2017) were applied for a space−time region to be considered a drought event: (i) single drought areas must be larger than 10% (∼20,000 km2) of Great Britain (mainland), this criterion was selected to ensure that only areas with a reasonable size and therefore impact are considered as drought event candidates; (ii) the overlap of the areas must be at least 50% of the smaller area; and (iii) the smaller area must be at least 25% of the larger area.
By using a quantile-based indicator for each pixel (rather than indicators based on absolute values of precipitation), the departure from “normal” conditions are described. Therefore drought events occurring at different places (e.g., NW and SE) can be compared.
The concept of drought severity is used to rank the drought events. We consider that the measure of severity should take into account drought intensity, area and duration, so that an event becomes more severe if (i) the quantile drought intensity qint is large, (ii) the area under drought is large, and (iii) the duration of the drought is large (Haslinger and Blöschl, 2017). The first two components are combined into an intensity measure for every time step over the drought duration:
where I is the intensity, n is the number of grid points i within the drought area (DA), and qint is the quantile drought intensity. Consequently, I increases with both the number of drought grid cells and their quantile drought intensity.
We calculate the overall drought severity as:
where S is the severity, which is the sum of all intensities I within the same drought event (DE), and m is the number of time steps j comprising the drought event.
The mean intensity is defined by severity divided by duration.
Geographical Clustering
In Great Britain, there is a very strong south-east to north-west rainfall gradient, with nearly an order of magnitude difference in annual rainfall between the driest parts of south-east England around the Thames estuary and the wettest parts of the mountains of western Scotland and north Wales. The scale of spatial variation in annual and seasonal rainfall implies a need to examine drought occurrence and dynamics on a regional scale rather than nationally. On average, the north-west is substantially wetter than the south-east and behave differently in terms of precipitation (Mayes and Wheeler, 2013), with the two regions often being anticorrelated with each other, meaning droughts in one region are unlikely to affect the other (Folland et al., 2015).
In this study, we aim at comparing the north-west and south-east in terms of their drought characteristics (including area, duration, intensity and severity), to understand the natural and physical differences in drought dynamics between these two distinct regions. To define the geographical extent of the North-West (NW) and South-East (SE), we applied the k-means clustering technique (e.g., Gordon, 1981; Raut et al., 2017) to monthly series of gridded precipitation, initially specifying two clusters. The monthly precipitation series in nearby grid cells are likely to be well correlated with each other, and can be expected to lead to similar drought characteristics within each region. The k-means clustering method is an unsupervised learning algorithm which aims to group the data into k groups where the data points are clustered based on feature similarity. In our case the feature is the monthly series of gridded precipitation.
The first k-means clustering attempt divided GB into two uneven regions, with the NW covering 1/3 of GB and the SE covering 2/3. This difference in size would have made a direct comparison of drought characteristics difficult. Therefore, a second k-means clustering analysis was carried out, this time specifying the use of three clusters. However, this also resulted in very different sized regions.
Instead, the strategy adopted was to use the k-means clustering technique applied in two successive steps: (i) first, the method was applied using two clusters, resulting in the two uneven regions described earlier (NW = 1/3 of GB and SE = 2/3 of GB); (ii) then, in a second step, the k-means clustering technique was applied again to the largest of the two regions (SE) to divide it into two sub-regions. Using this two-step process, three regions with very similar size were obtained and are shown in Figure 1. The NW and SE regions are now separated by a “transition region.”
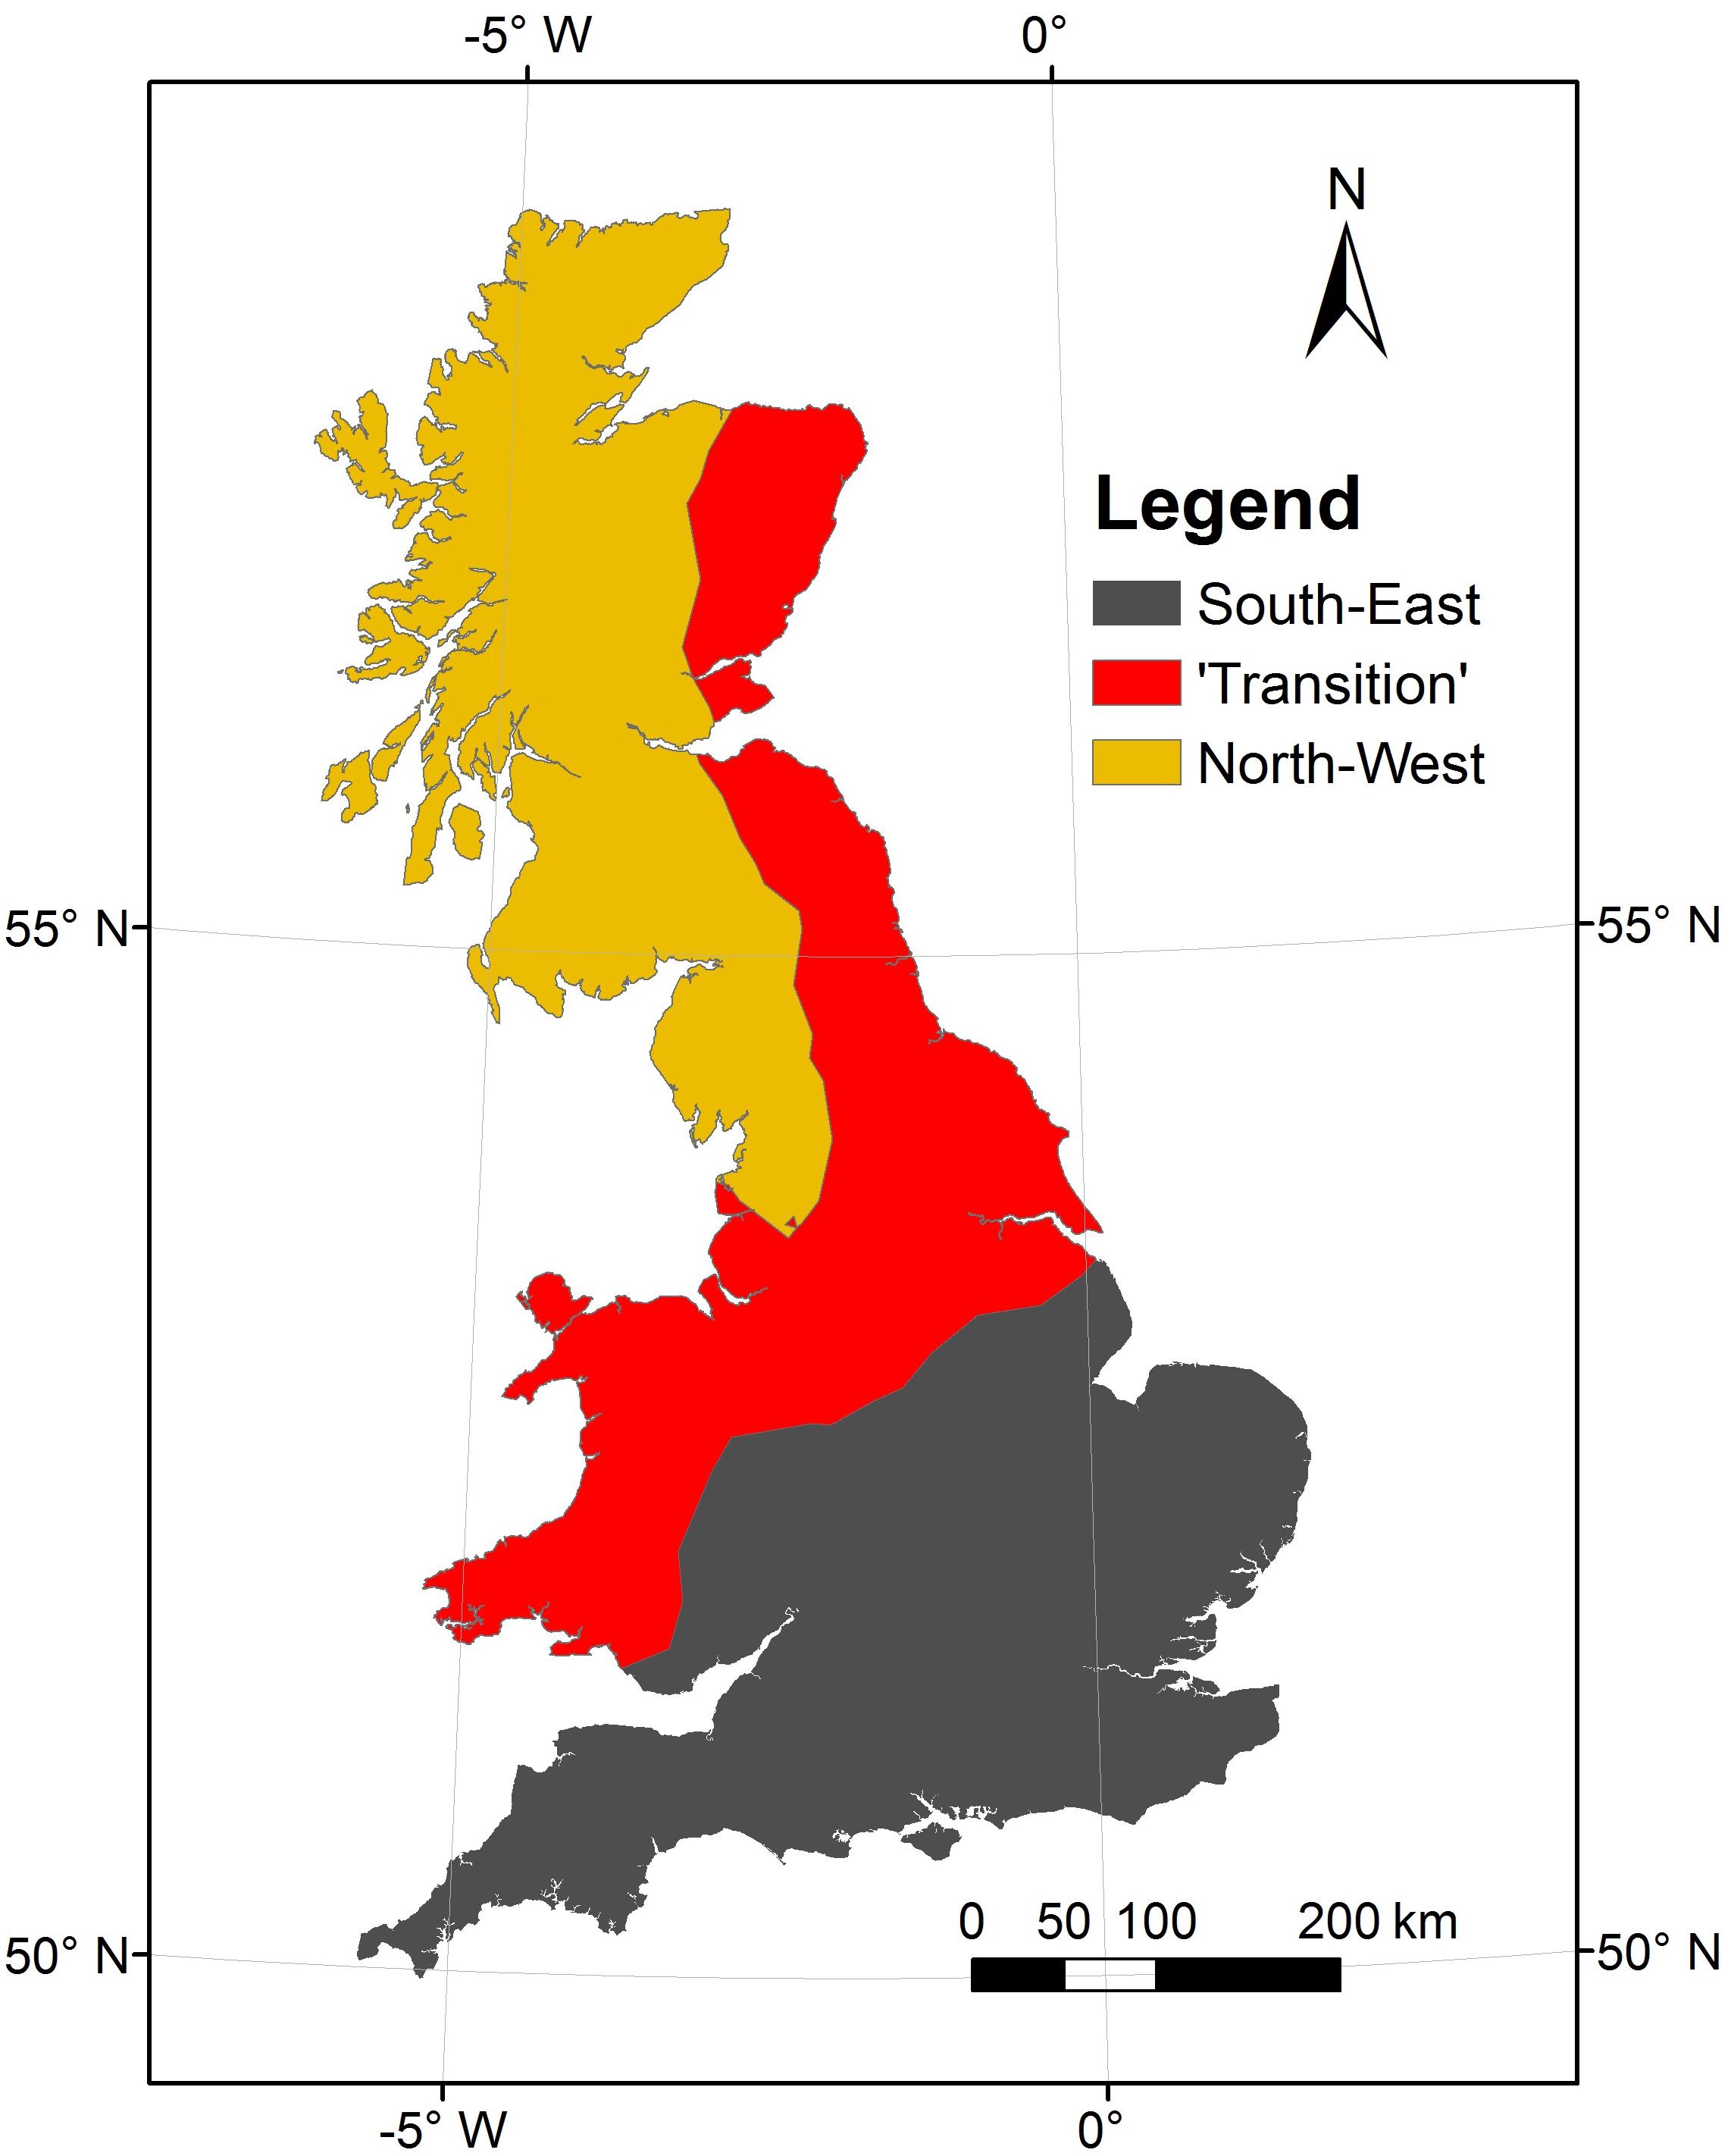
Figure 1. Great Britain rainfall regions defined using k-means clustering technique applied in two steps.
Assignment of Drought Events to a Region
To assign each identified drought event to one of the three regions, the concept of a Drought Core Region (DCR) was used. The DCR, initially proposed by Haslinger and Blöschl (2017), is defined as those grid points of an identified event with a time-average qint of at least 0.5, which represents a non-exceedance probability of 0.1 or an SPI of −1.29. Consequently, the DCR identifies those areas of a particular drought event where the precipitation deficit is most pronounced.
Each drought event was assigned to the region containing the largest proportion of the DCR. If a drought event does not have a DCR (no area with a time-average qint≥0.5), the drought event was assigned to the region containing the largest proportion of the total DA (i.e., the DA aggregated across all the time steps of the DE).
Frequency Analysis
Return Periods
To compare the frequency of occurrence of drought events in the three regions, the concept of return period was used. A return period is defined as the inverse of the exceedance probability (generally expressed in %). For example, a return period of 100 years corresponds to a probability of 1 in 100, or 1%, that an event of a particular magnitude will be exceeded in any one year. Return periods of droughts for different characteristics (area, duration, intensity and severity) were calculated using the following approach:
The drought events, x, were ranked in ascending order according to the characteristic considered (e.g., area affected by a given drought) with ranks from 1 to N (i.e., the total number of events). In case of a tie, the average of the ranks was given to all events in the tie. The preliminary non-exceedance probability (or cumulative distribution function, CDF), G(xi) for the event with rank i is then defined as:
Using N+1 rather than N means that we never get a non-exceedance probability of 1, it will always be slightly lower than 1 at most (Coles, 2001).
To account for the fact that we have a peak-over-threshold series (rather than an annual series of a maximum or minimum per year), with either more or fewer than n events (n being the number of years), we define the rate λ, which is the average number of events per year:
Assuming that the events are independent, and that the probability of non-exceedance of x over a 1-year period is given by the Poisson distribution, we derive the final CDF, F(x), for the corresponding annual maximum series, as described by Stedinger et al. (1993). F(x) is the probability that the annual maximum for a year will not exceed x:
The corresponding return period T is then calculated as:
[1−F(xi)] corresponds to the exceedance probability.
Trend Analysis
In order to analyse the change in drought frequency over time, we estimated the (changing) return period of a fixed drought severity for different 50-year windows within the total study period.
This was done in two steps:
• First, the drought severity corresponding to the 10-year return period based on the entire period of observation (154 years), called the “global 10-year return level,” was calculated, for each accumulation period and each region. When applying the methodology described in Return Periods, once all the events were ranked, the observation with return period just above 10 years and the one with a return period just below 10 years were selected, and linear interpolation was used to calculate the “global 10-year return level.”
• We then considered different 50-year periods within the full study period, shifted by 5 years at a time, and repeated the frequency estimation within each of these 50-year windows. In the ranked drought events within each period, the event with severity just larger than, and just smaller than the “global 10-year return level” were selected, and the corresponding return period was calculated using linear interpolation between the two. We call this new return period the “sub-interval return period.”
If the “sub-interval return period” is smaller (larger) than 10 years, it indicates that droughts of the severity corresponding to the “global 10-year return level” in that 50-year window are more (less) frequent than over the whole period.
Results
Drought Events Per Region
The first research question motivating this study was to find out whether there is a difference in frequency of drought events between the three regions of GB, with a particular focus on the differences between the SE and the NW.
Figure 2 shows the proportion of drought events (for the different accumulation periods analysed) assigned to each region when considering different ranking of events in terms of severity as defined in Eq. 3. For the most severe droughts (top 20 droughts), the SE region shows the largest proportion of events. For shorter accumulation periods (3 and 6 months), the “transition” region has the second largest proportion of most severe events, whereas for longer accumulation periods (12 and 24 months), the NW has a larger proportion of severe events than the “transition” region.
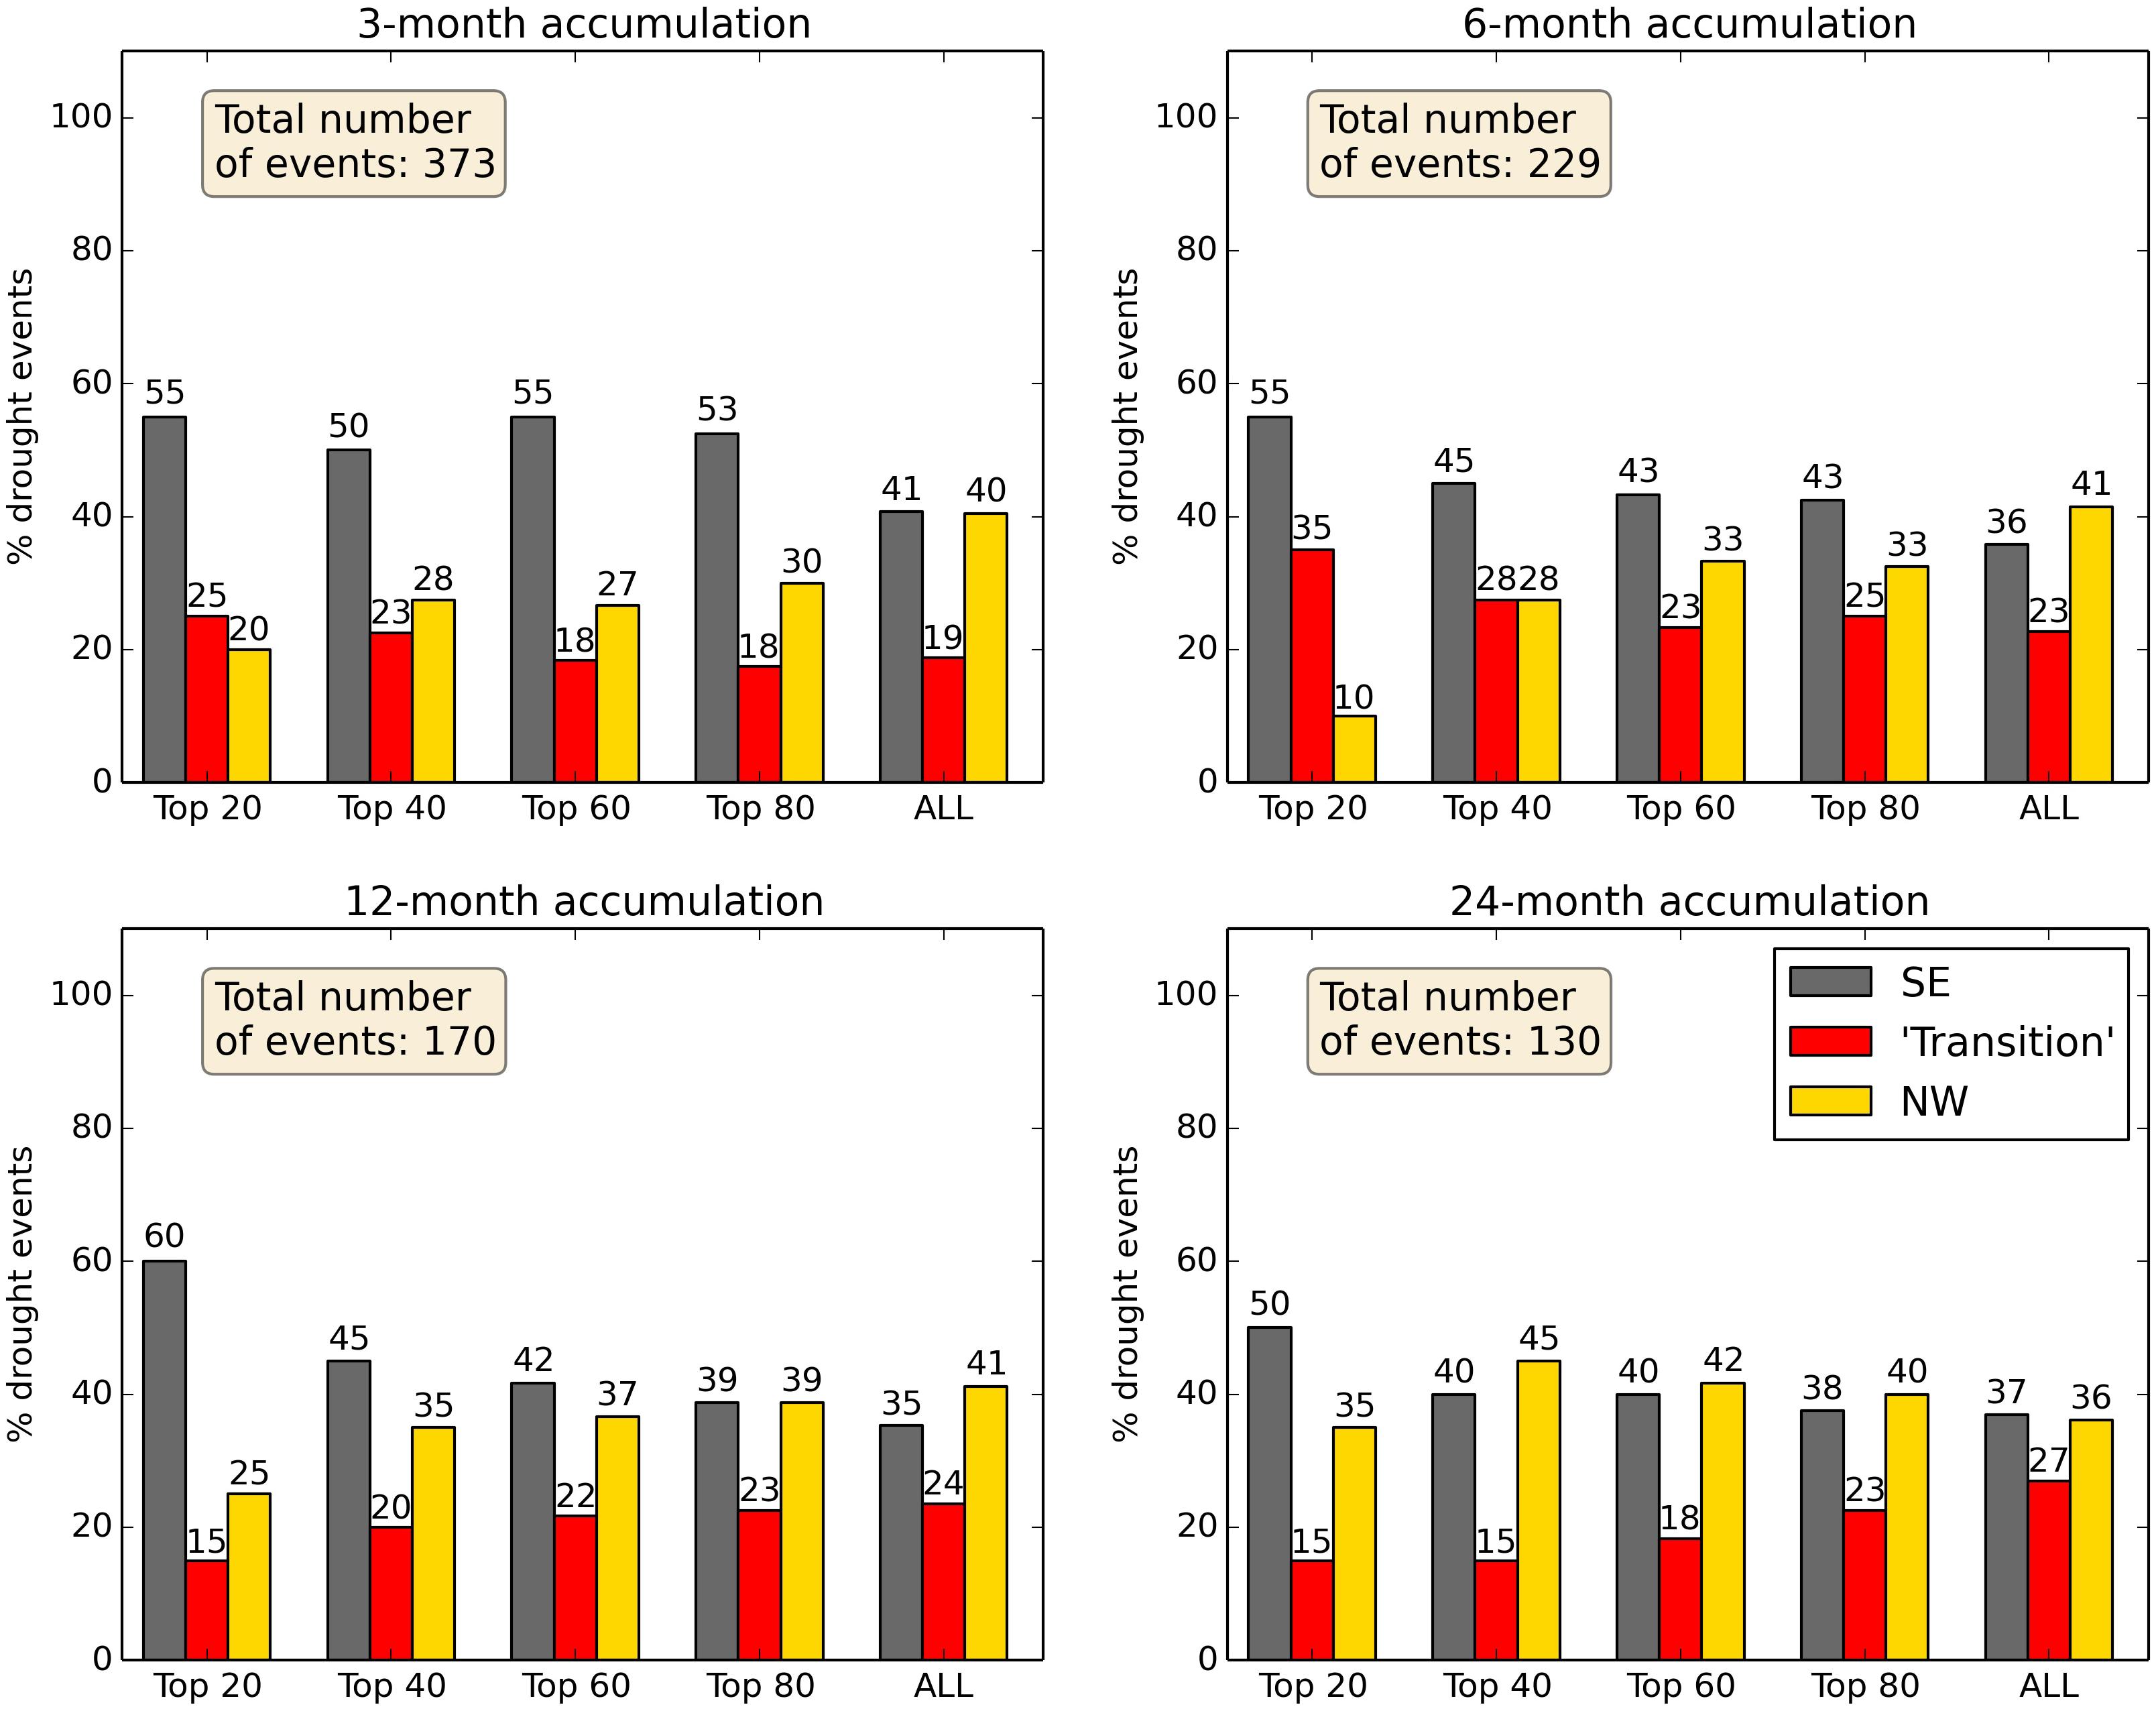
Figure 2. Proportion (in %) of drought events in each region according to drought severity ranking for different accumulation periods. “Top 20,” “Top 40,” “Top 60,” and “Top 80” correspond respectively to the 20, 40, 60, and 80 most severe droughts in GB during our study period (1862–2015). The last set of bars (labelled “ALL”) on each graph include all drought events detected in GB. The events were ranked from most severe to less severe based on the drought severity as defined in Eq. 3.
As the severity of events decreases (top 40, top 60, top 80 and all events), so does the proportion of events assigned to the SE region, particularly for longer accumulation periods. When all events are considered, the proportion of events occurring in SE and NW is almost equal for all accumulation periods whilst the “transition” region has fewer drought events than the other two regions. These results suggest that the majority of the most severe drought events take place in the SE, but a larger number of less severe events occur in the NW.
Frequency Analysis of Droughts
For the second research question, we looked at the differences in drought characteristics between the SE and NW, in terms of area affected, duration, intensity and severity. Return periods for these characteristics were calculated as described in Section “Frequency Analysis.”
Return Periods
Mean area
Figure 3 shows the return period of drought events based on their mean drought area ( for the three regions considered. For short accumulation periods (3 months), little difference is observed between the three regions. For medium accumulation periods (6 and 12 months), larger events are more frequent (shorter return period for the same mean area) in the SE compared with the other two regions. However, for long accumulation period (24 months), droughts affecting large areas are more frequent in the NW whereas droughts affecting smaller areas are more frequent in the SE.
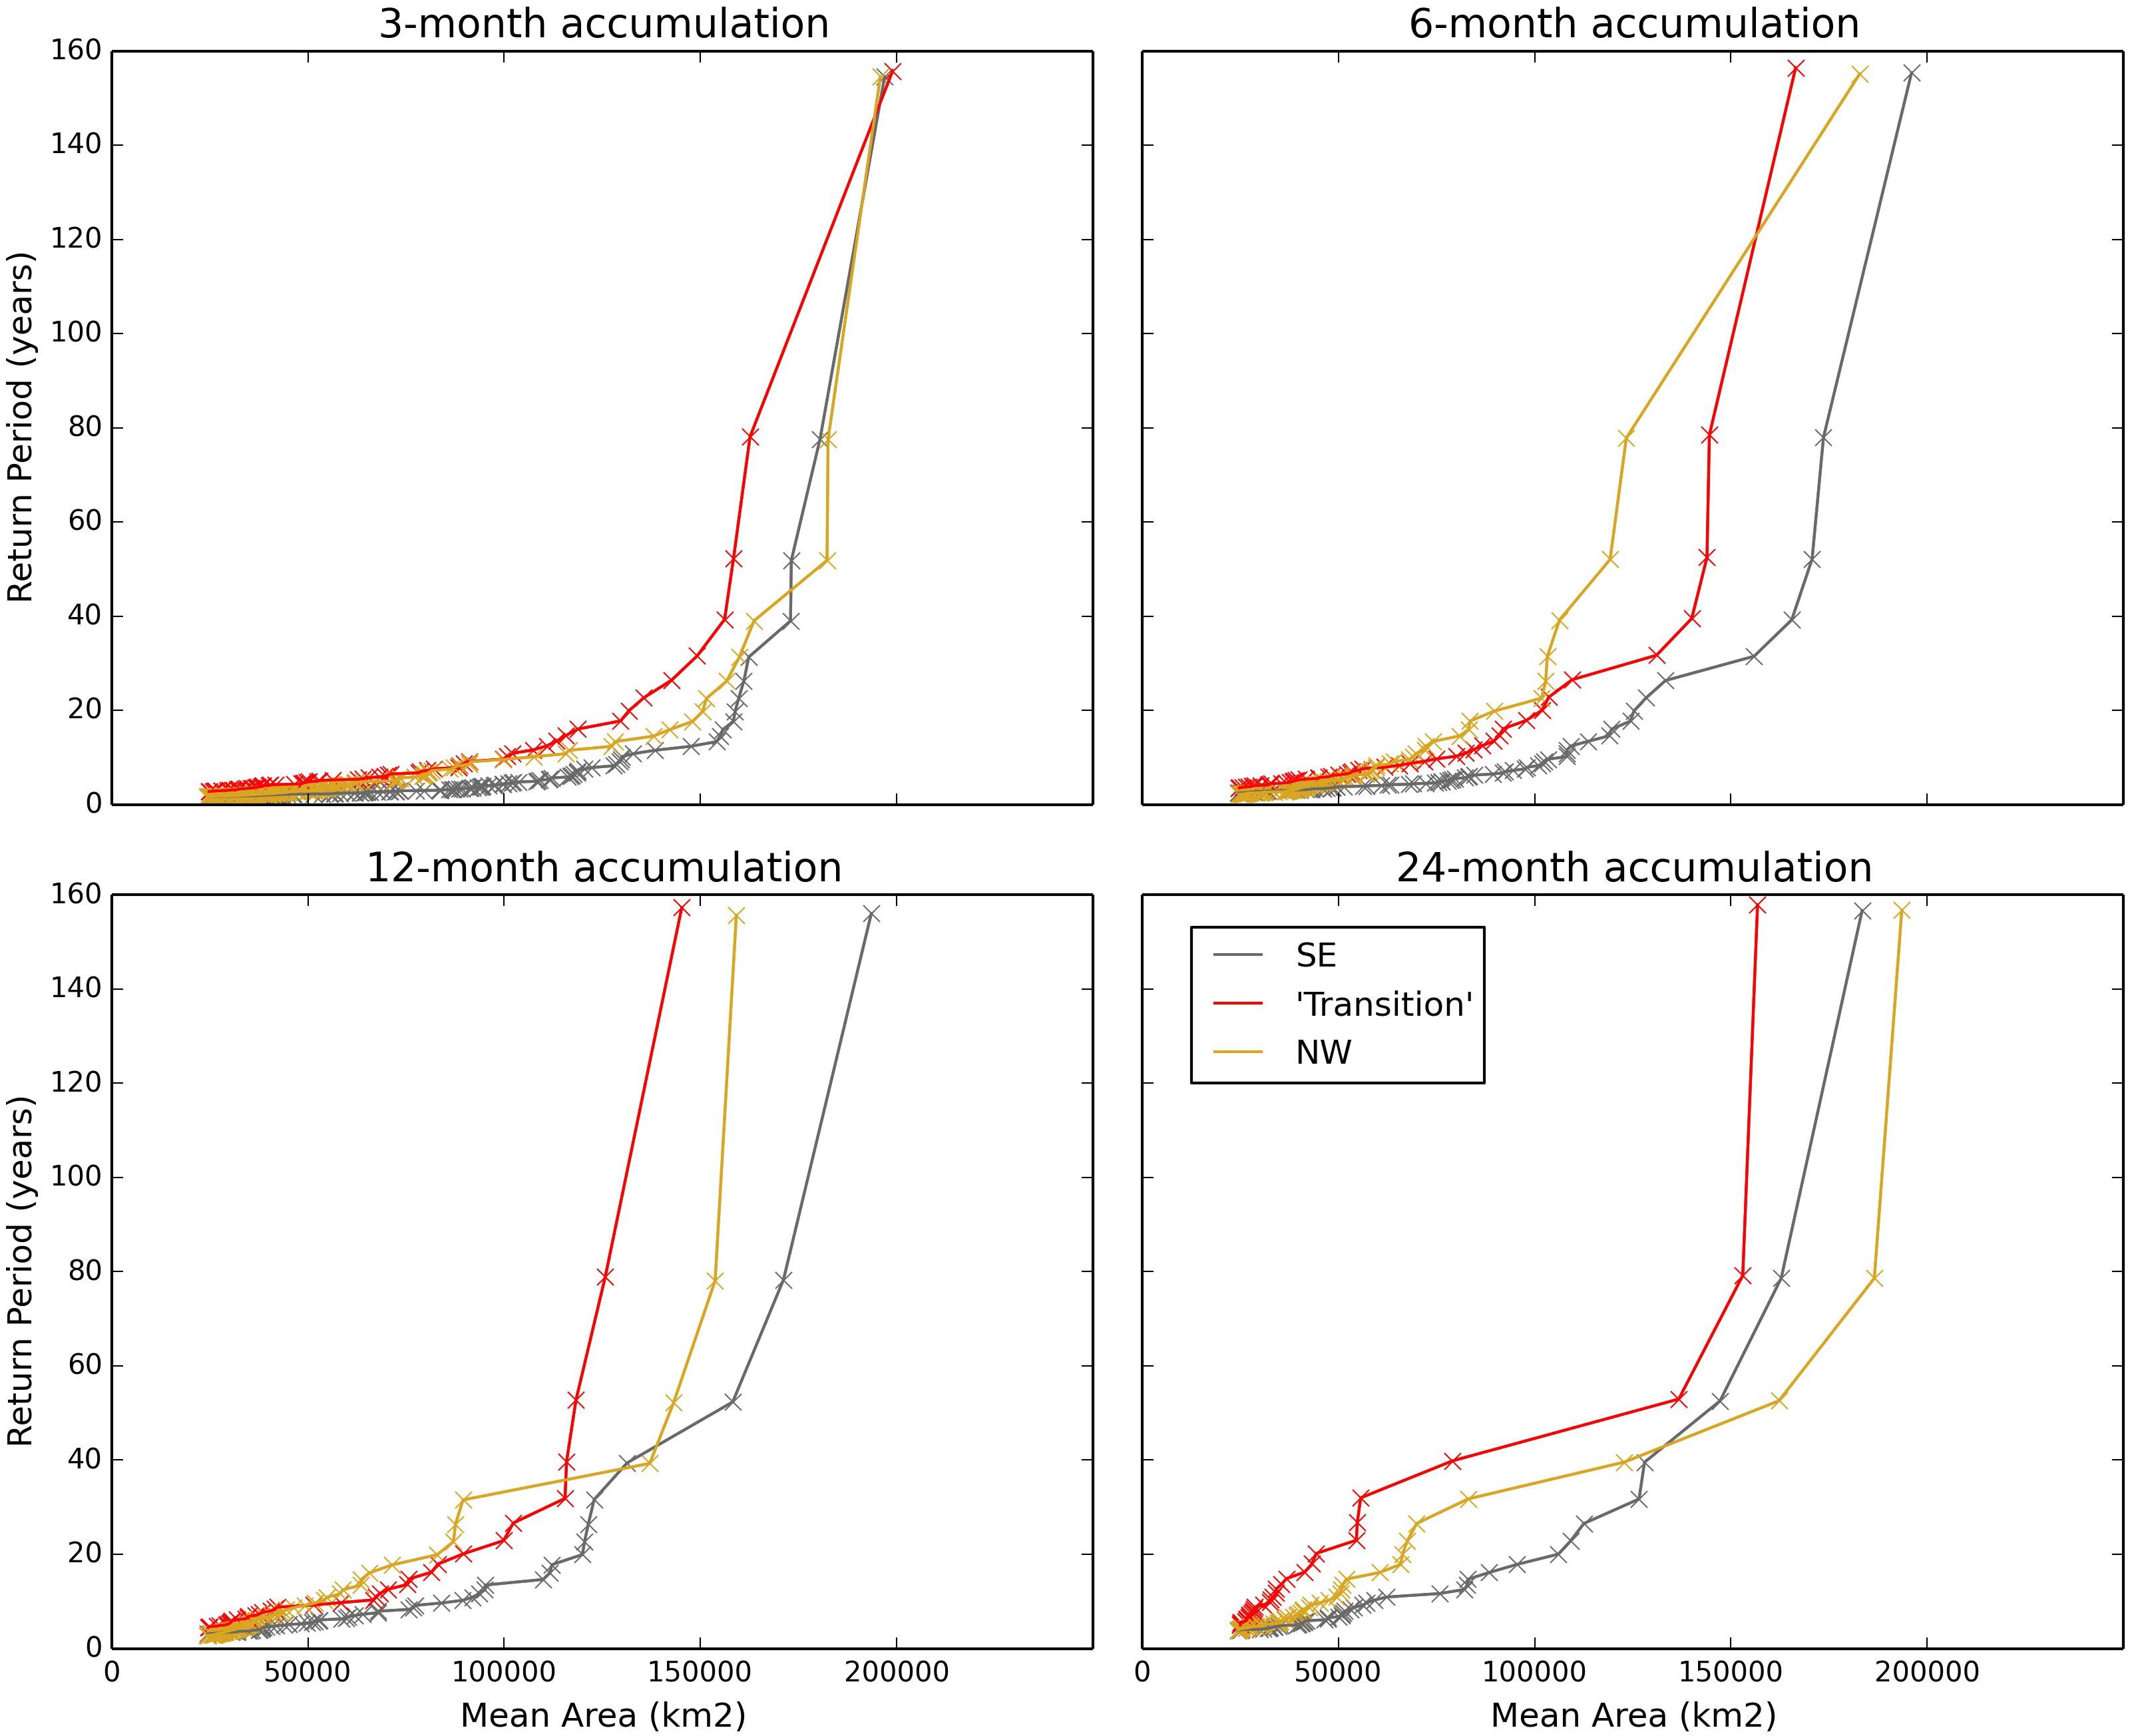
Figure 3. Return period of drought events calculated based on their mean area for the three regions of GB, and for different accumulation period of precipitation (3, 6, 12, and 24 months).
Duration
Figure 4 shows the return period of drought events based on their duration for the three regions studied. Longer droughts are more frequent (i.e., have a shorter return period for the same duration) in the SE than in the NW for short and medium accumulation periods (3, 6, and 12 months accumulation period). The opposite is observed for long accumulation periods (24 months). The “Transition” region shows similar return periods to the NW for 3 and 6 months accumulation periods, whereas it shows larger return periods for longer accumulation periods.
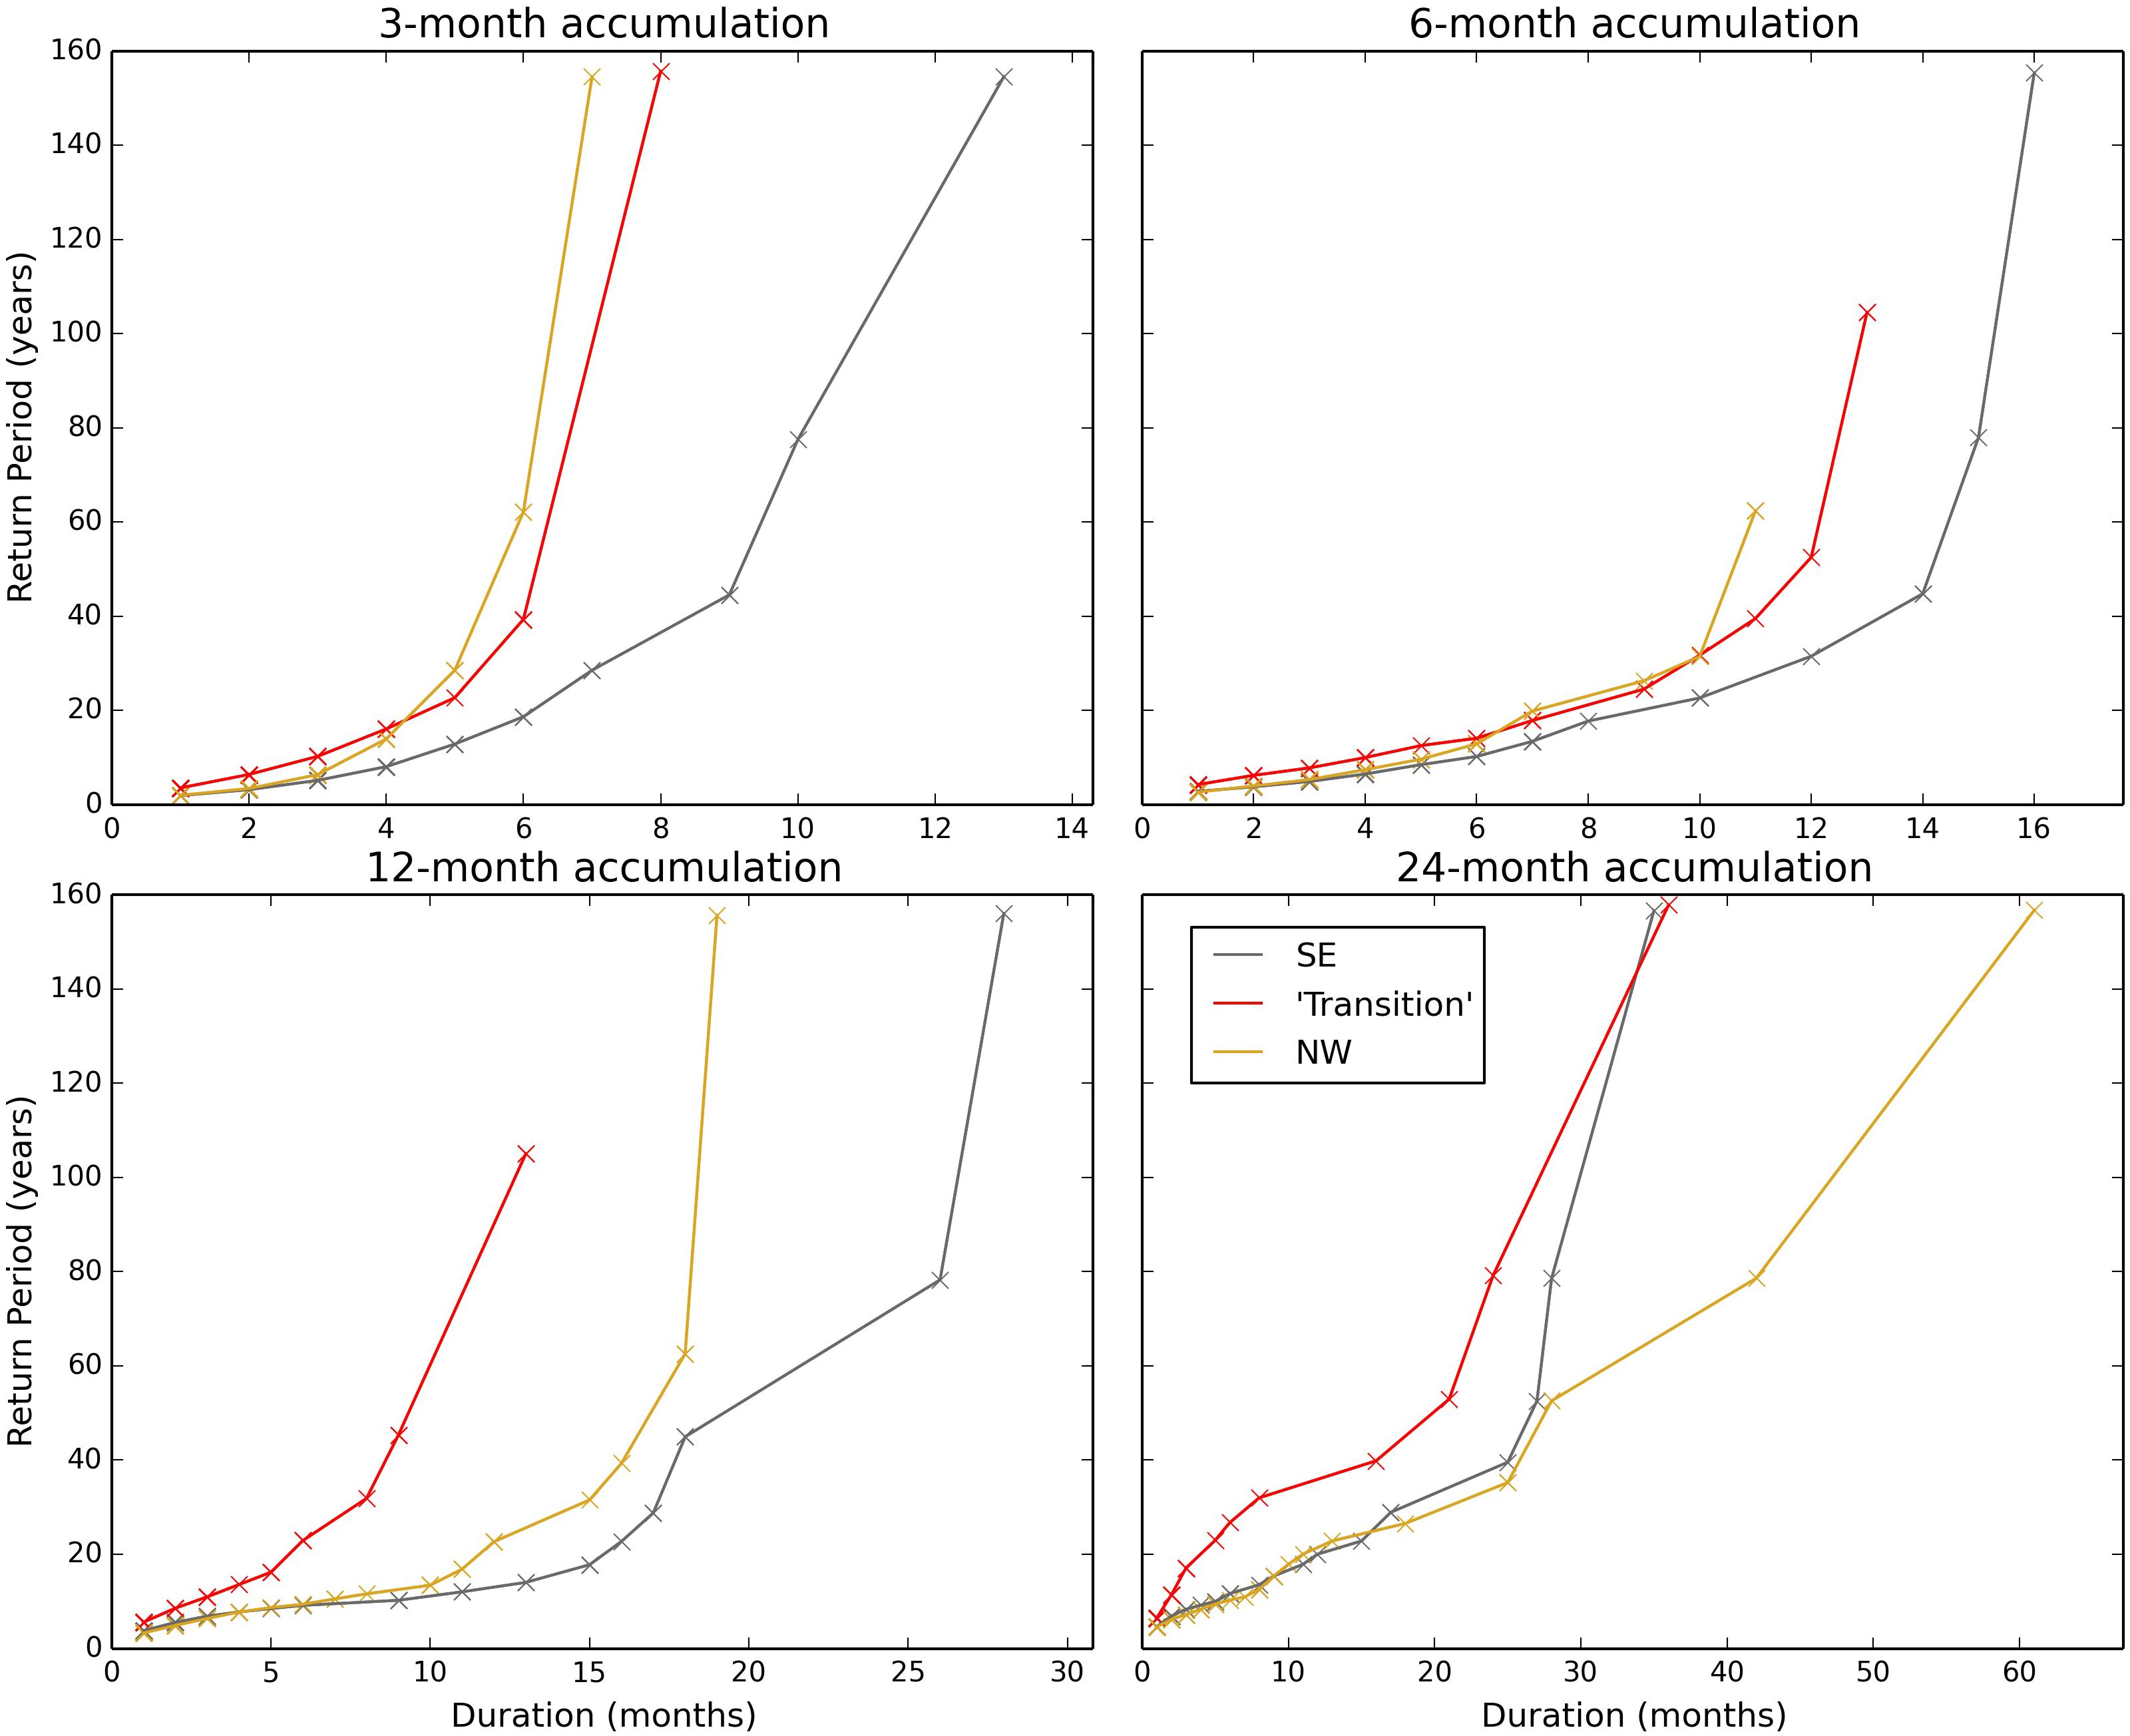
Figure 4. Return period of drought events calculated based on their duration for the three regions of GB, and for different accumulation period of precipitation (3, 6, 12, and 24 months).
Mean quantile drought intensity ()
Figure 5 shows the return period of drought events based on their mean quantile drought intensity () for the three regions studied. is a measure of how intense a given drought event is on average over each timestep and each pixel. From Figure 5, we can see that the local intensity of the drought events have similar return periods for the SE and NW for all accumulation periods. They are less intense for the same return period for the “transition” region, for all accumulation periods.
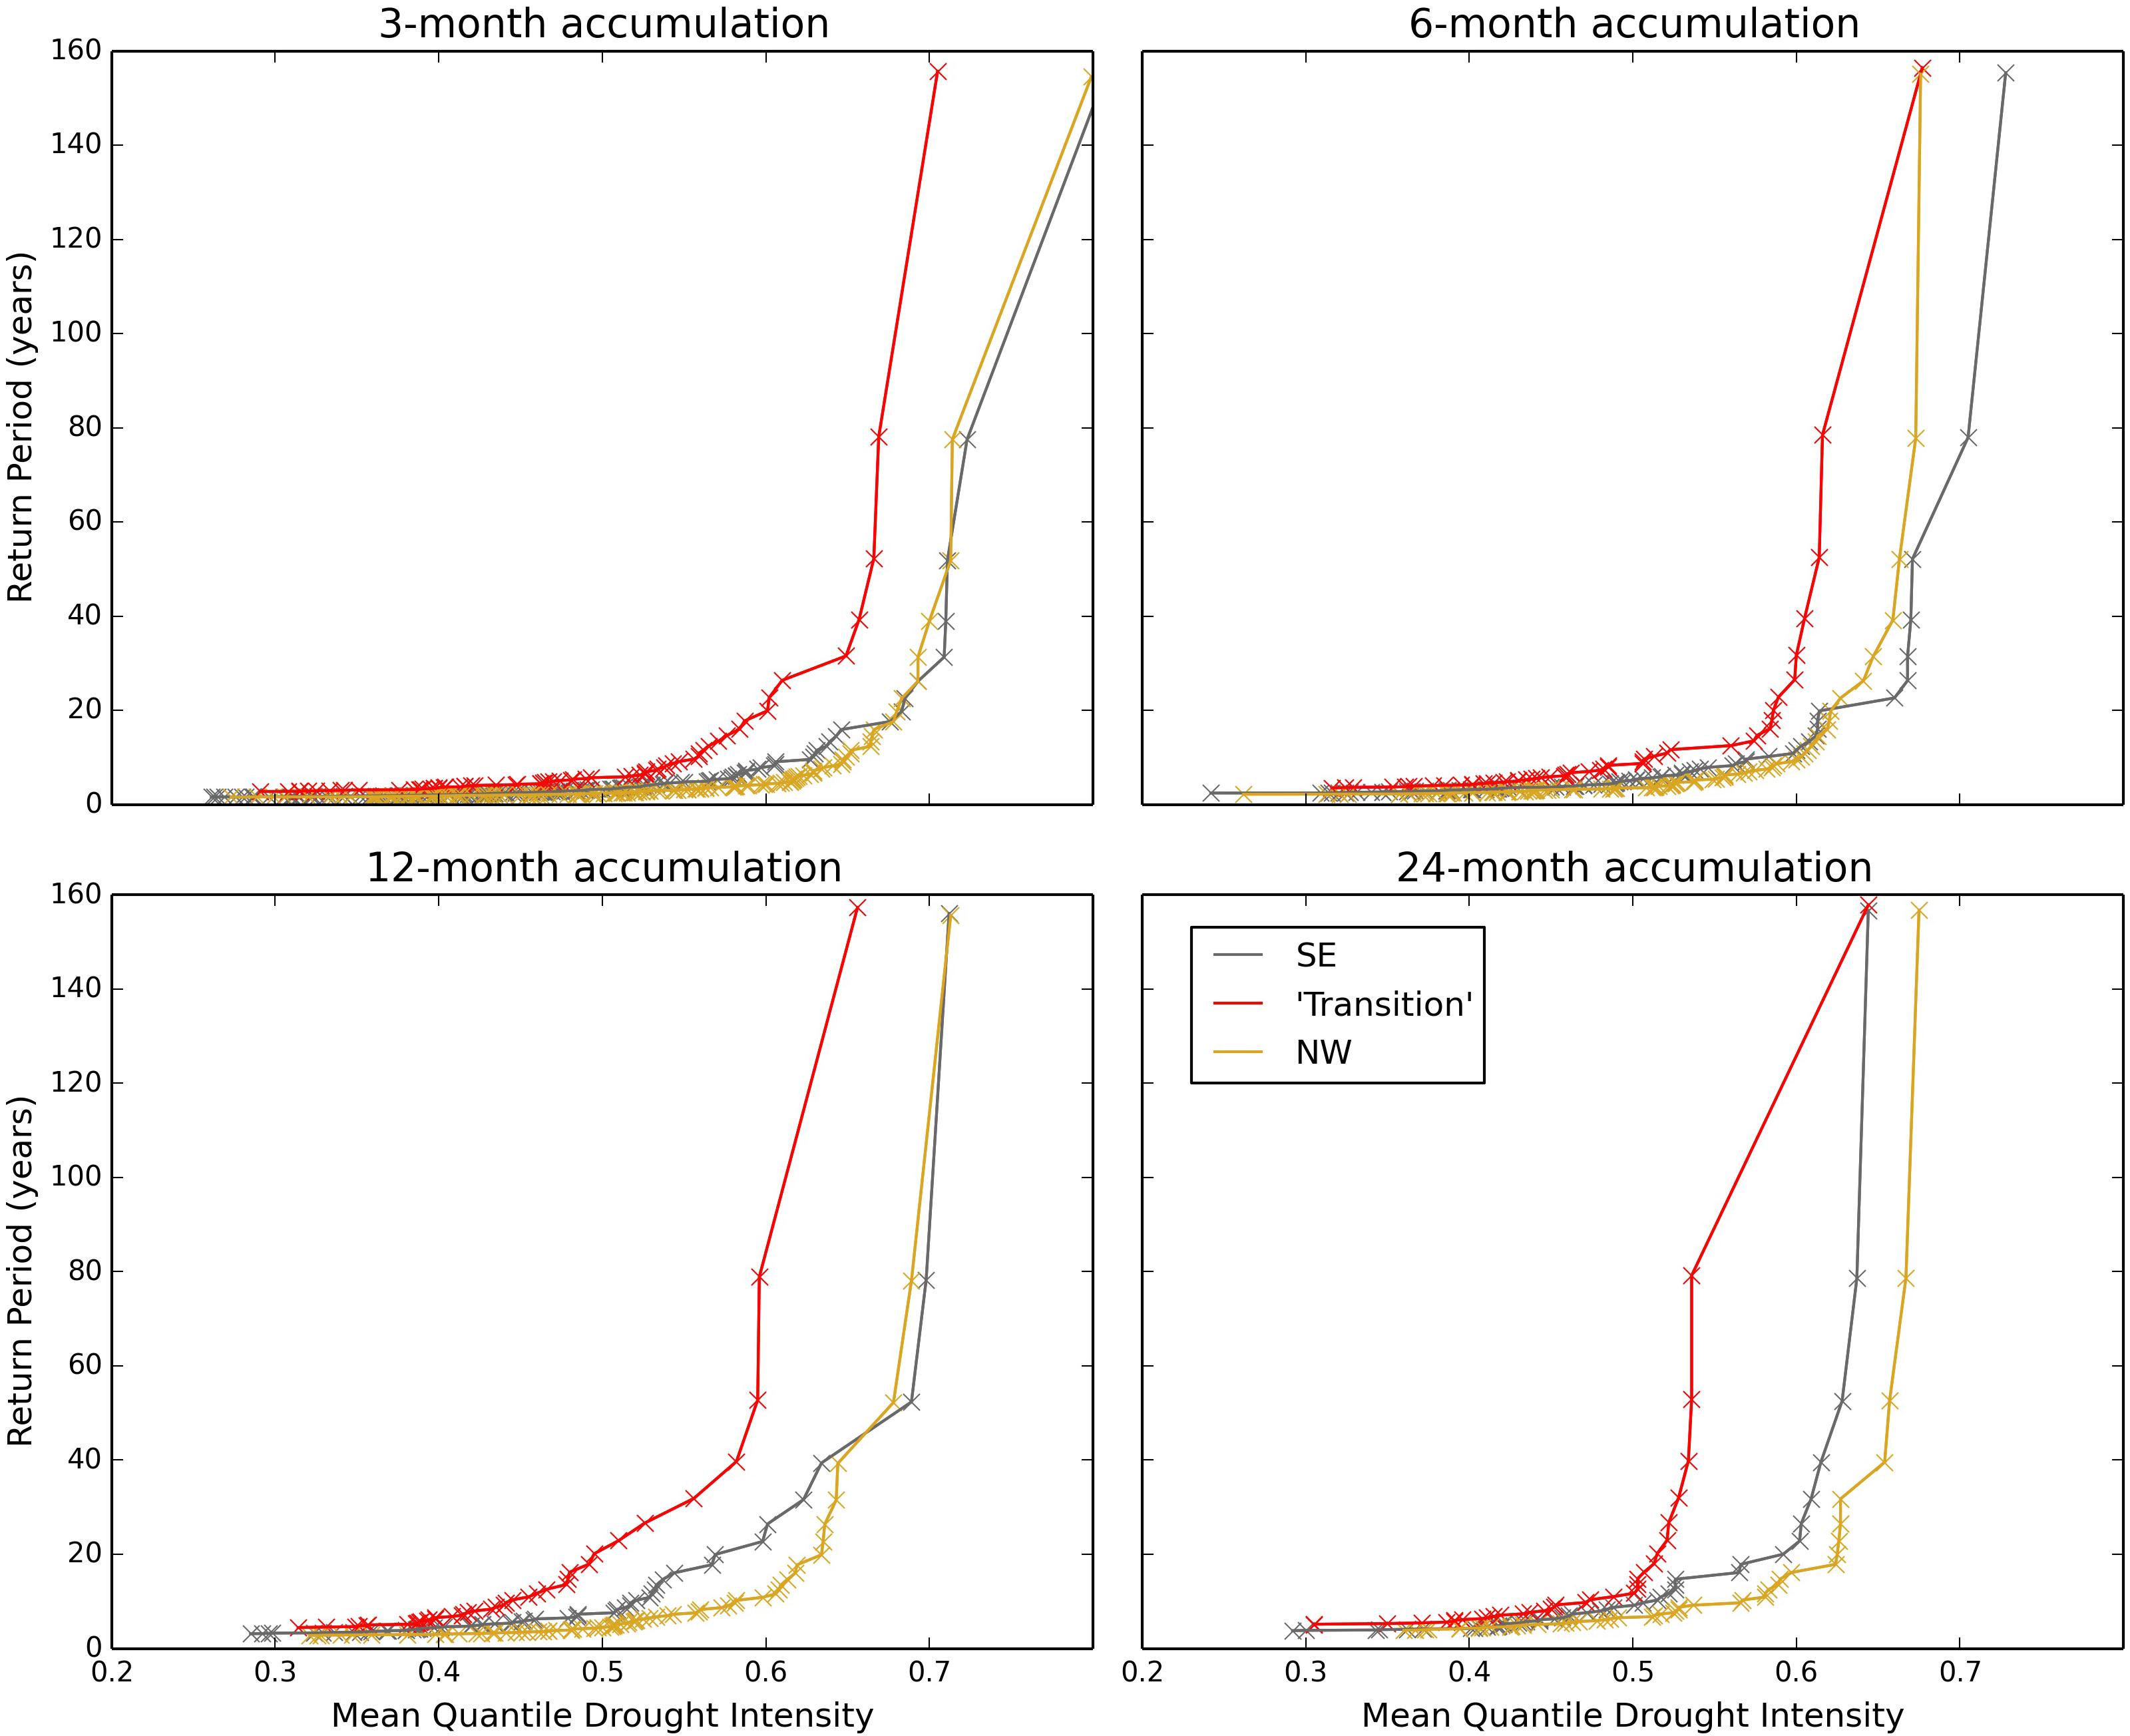
Figure 5. Return period of drought events calculated based on their mean quantile drought intensity () for the three regions of GB, and for different accumulation period of precipitation (3, 6, 12, and 24 months).
Severity
Figure 6 shows the return period of drought events based on their severity for the three regions studied. As shown in Eqs 2 and 3, the severity depends on qint, the mean area and the duration of a drought. The results for drought severity are therefore a combination of the results in the three previous paragraphs, although the relationship is not necessarily straightforward, as the events with longer duration are not necessarily the more intense, or more extensive ones. However, as expected from the results in the previous paragraphs, we do observe that the most severe droughts are more frequent (shorter return period) in the SE compared to the other two regions for short and medium accumulation periods (3, 6 and 12 months), whereas for long accumulation periods they are more frequent in the NW.
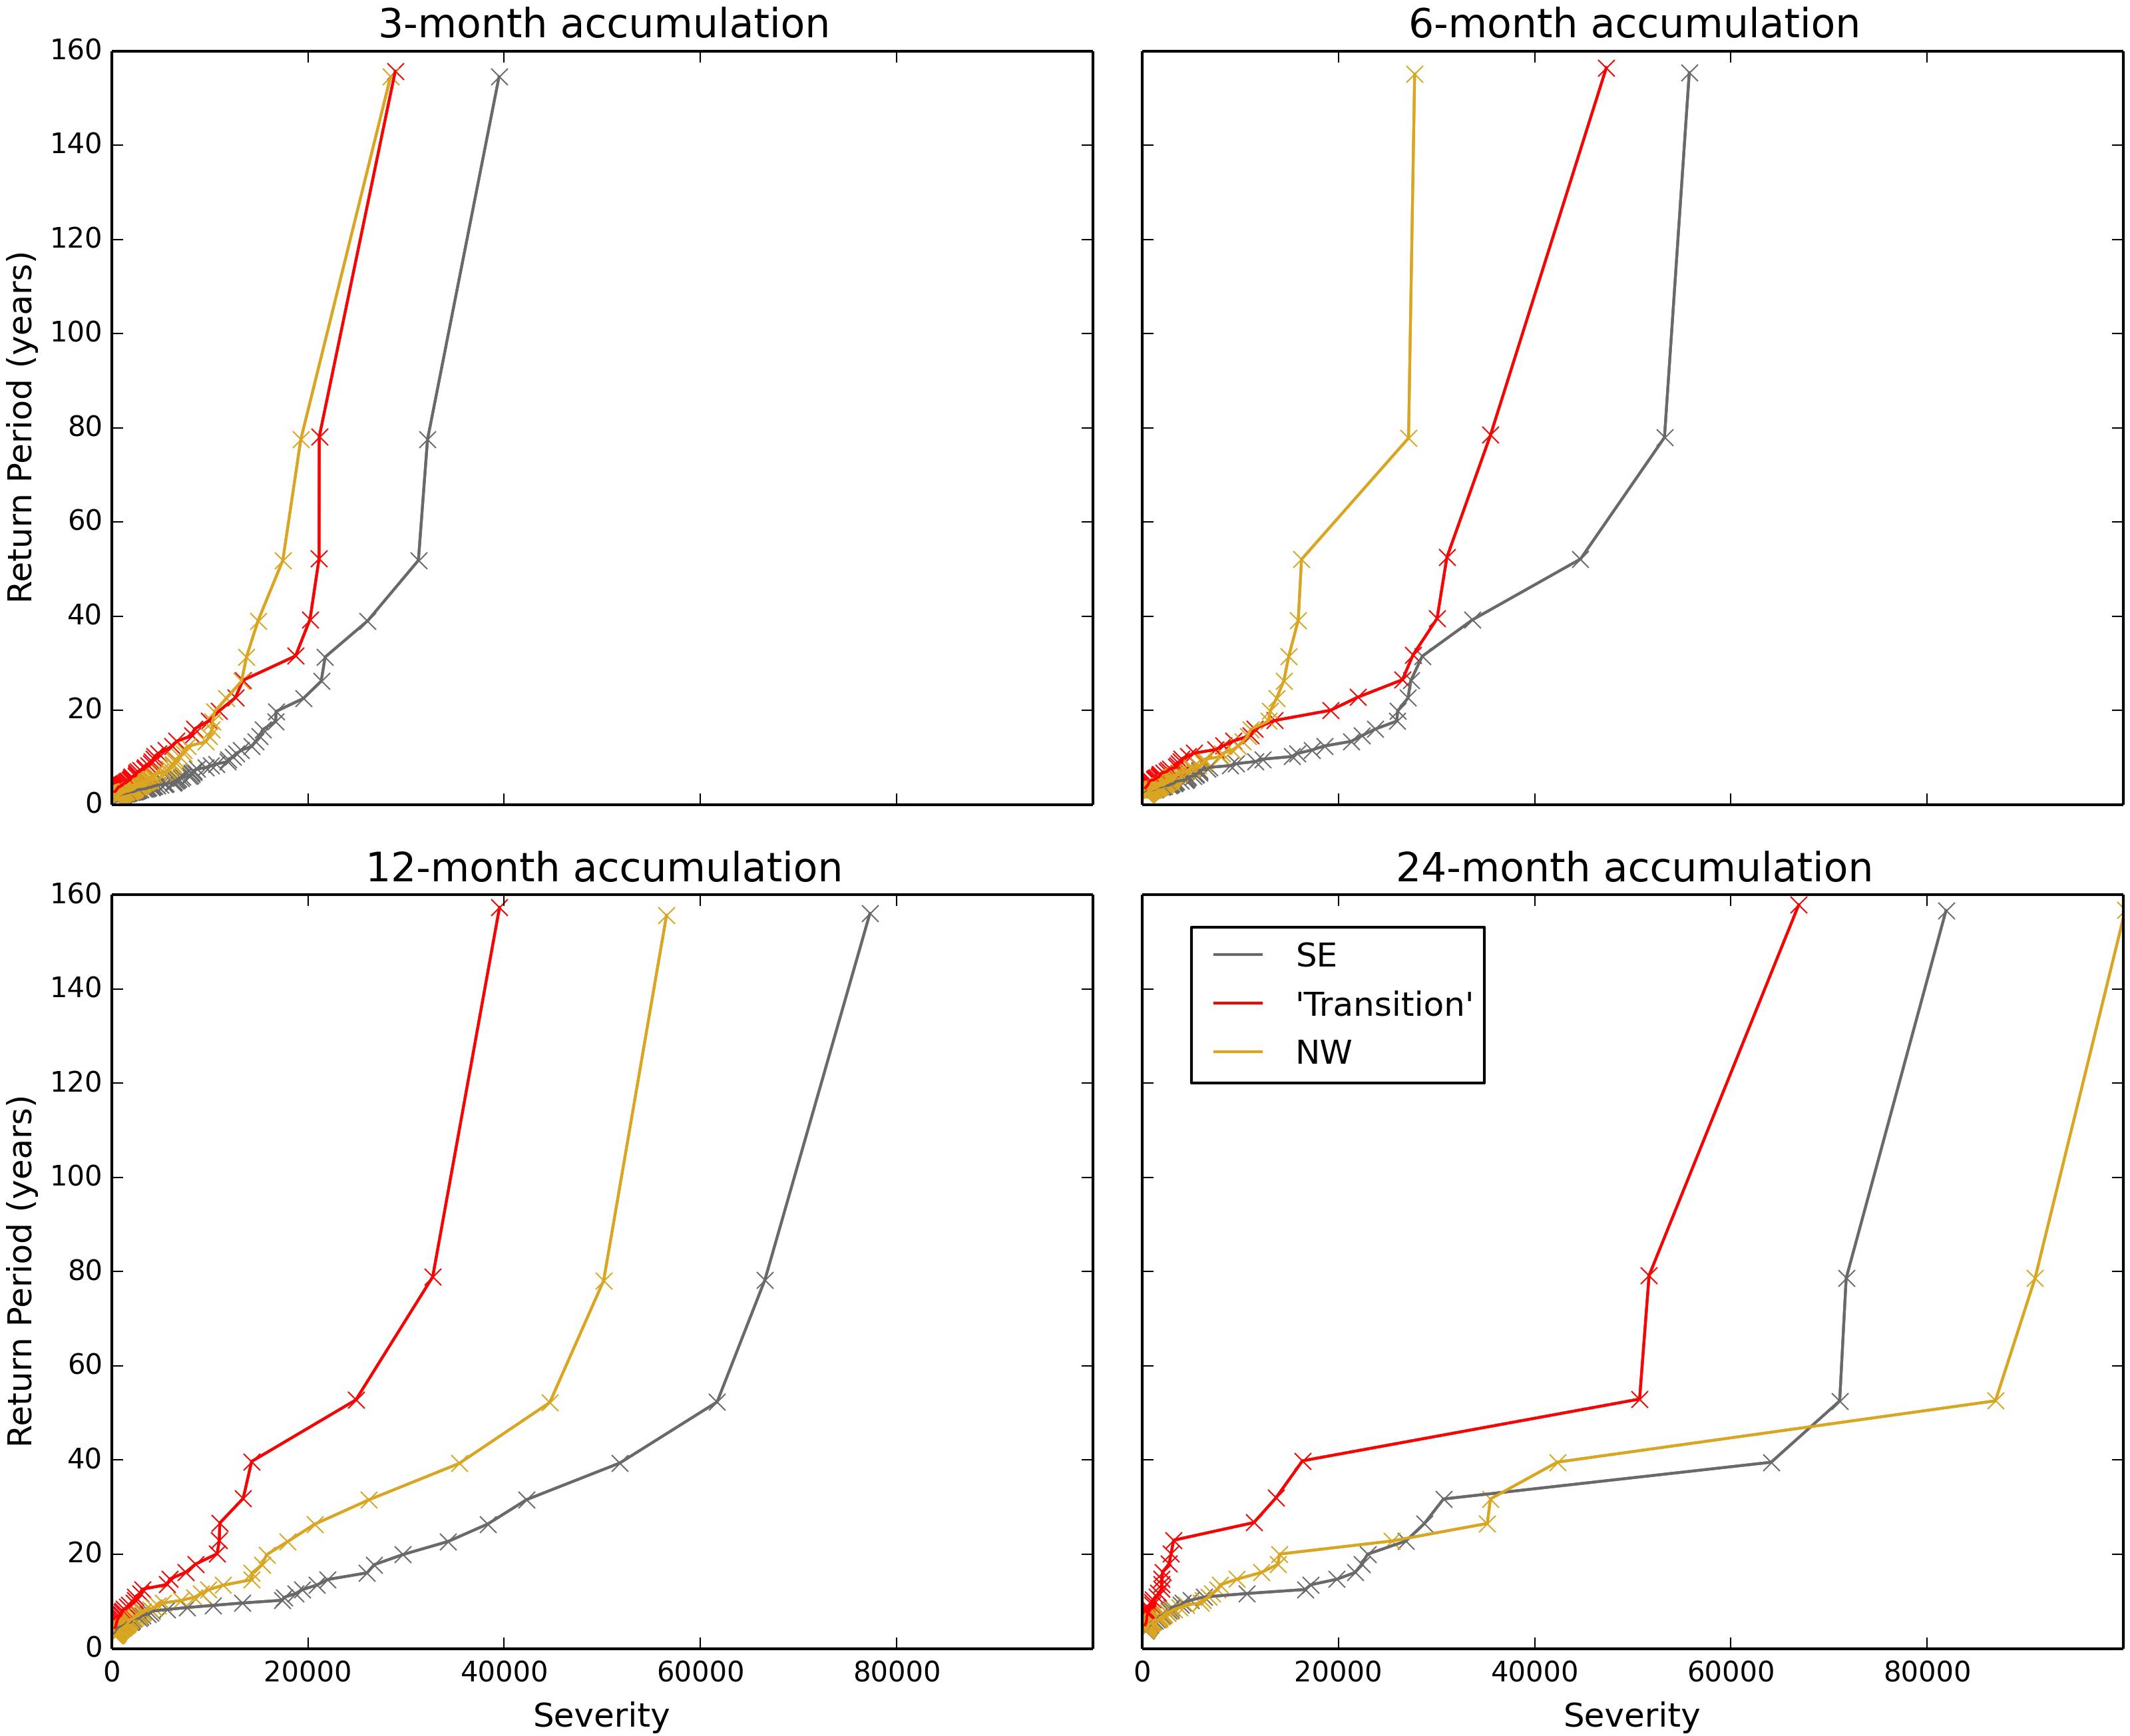
Figure 6. Return period of drought events calculated based on their severity for the three regions of GB, and for different accumulation period of precipitation (3, 6, 12, and 24 months).
Trend Analysis
The change in drought frequency over time was estimated by calculating the “global 10-year return level” and the “sub-interval return period” as described in Section “Data and Methods - Trend Analysis.” These calculations were carried out for each accumulation period and region, and for all 50-year windows shifted by 5 years at a time in the 1862–2015 period. Figure 7 shows the temporal variation of the “sub-interval return period” in the three regions. For the shorter accumulation periods, the data is noisier, but for longer accumulation periods (12 and 24-months), a clear multi-decadal alternation between drought rich periods in the SE (grey line in Figure 7 below 10-year) and drought rich period in the NW (yellow line in Figure 7 below 10-year) can be observed. The pattern is less clear for the transition region (red line).
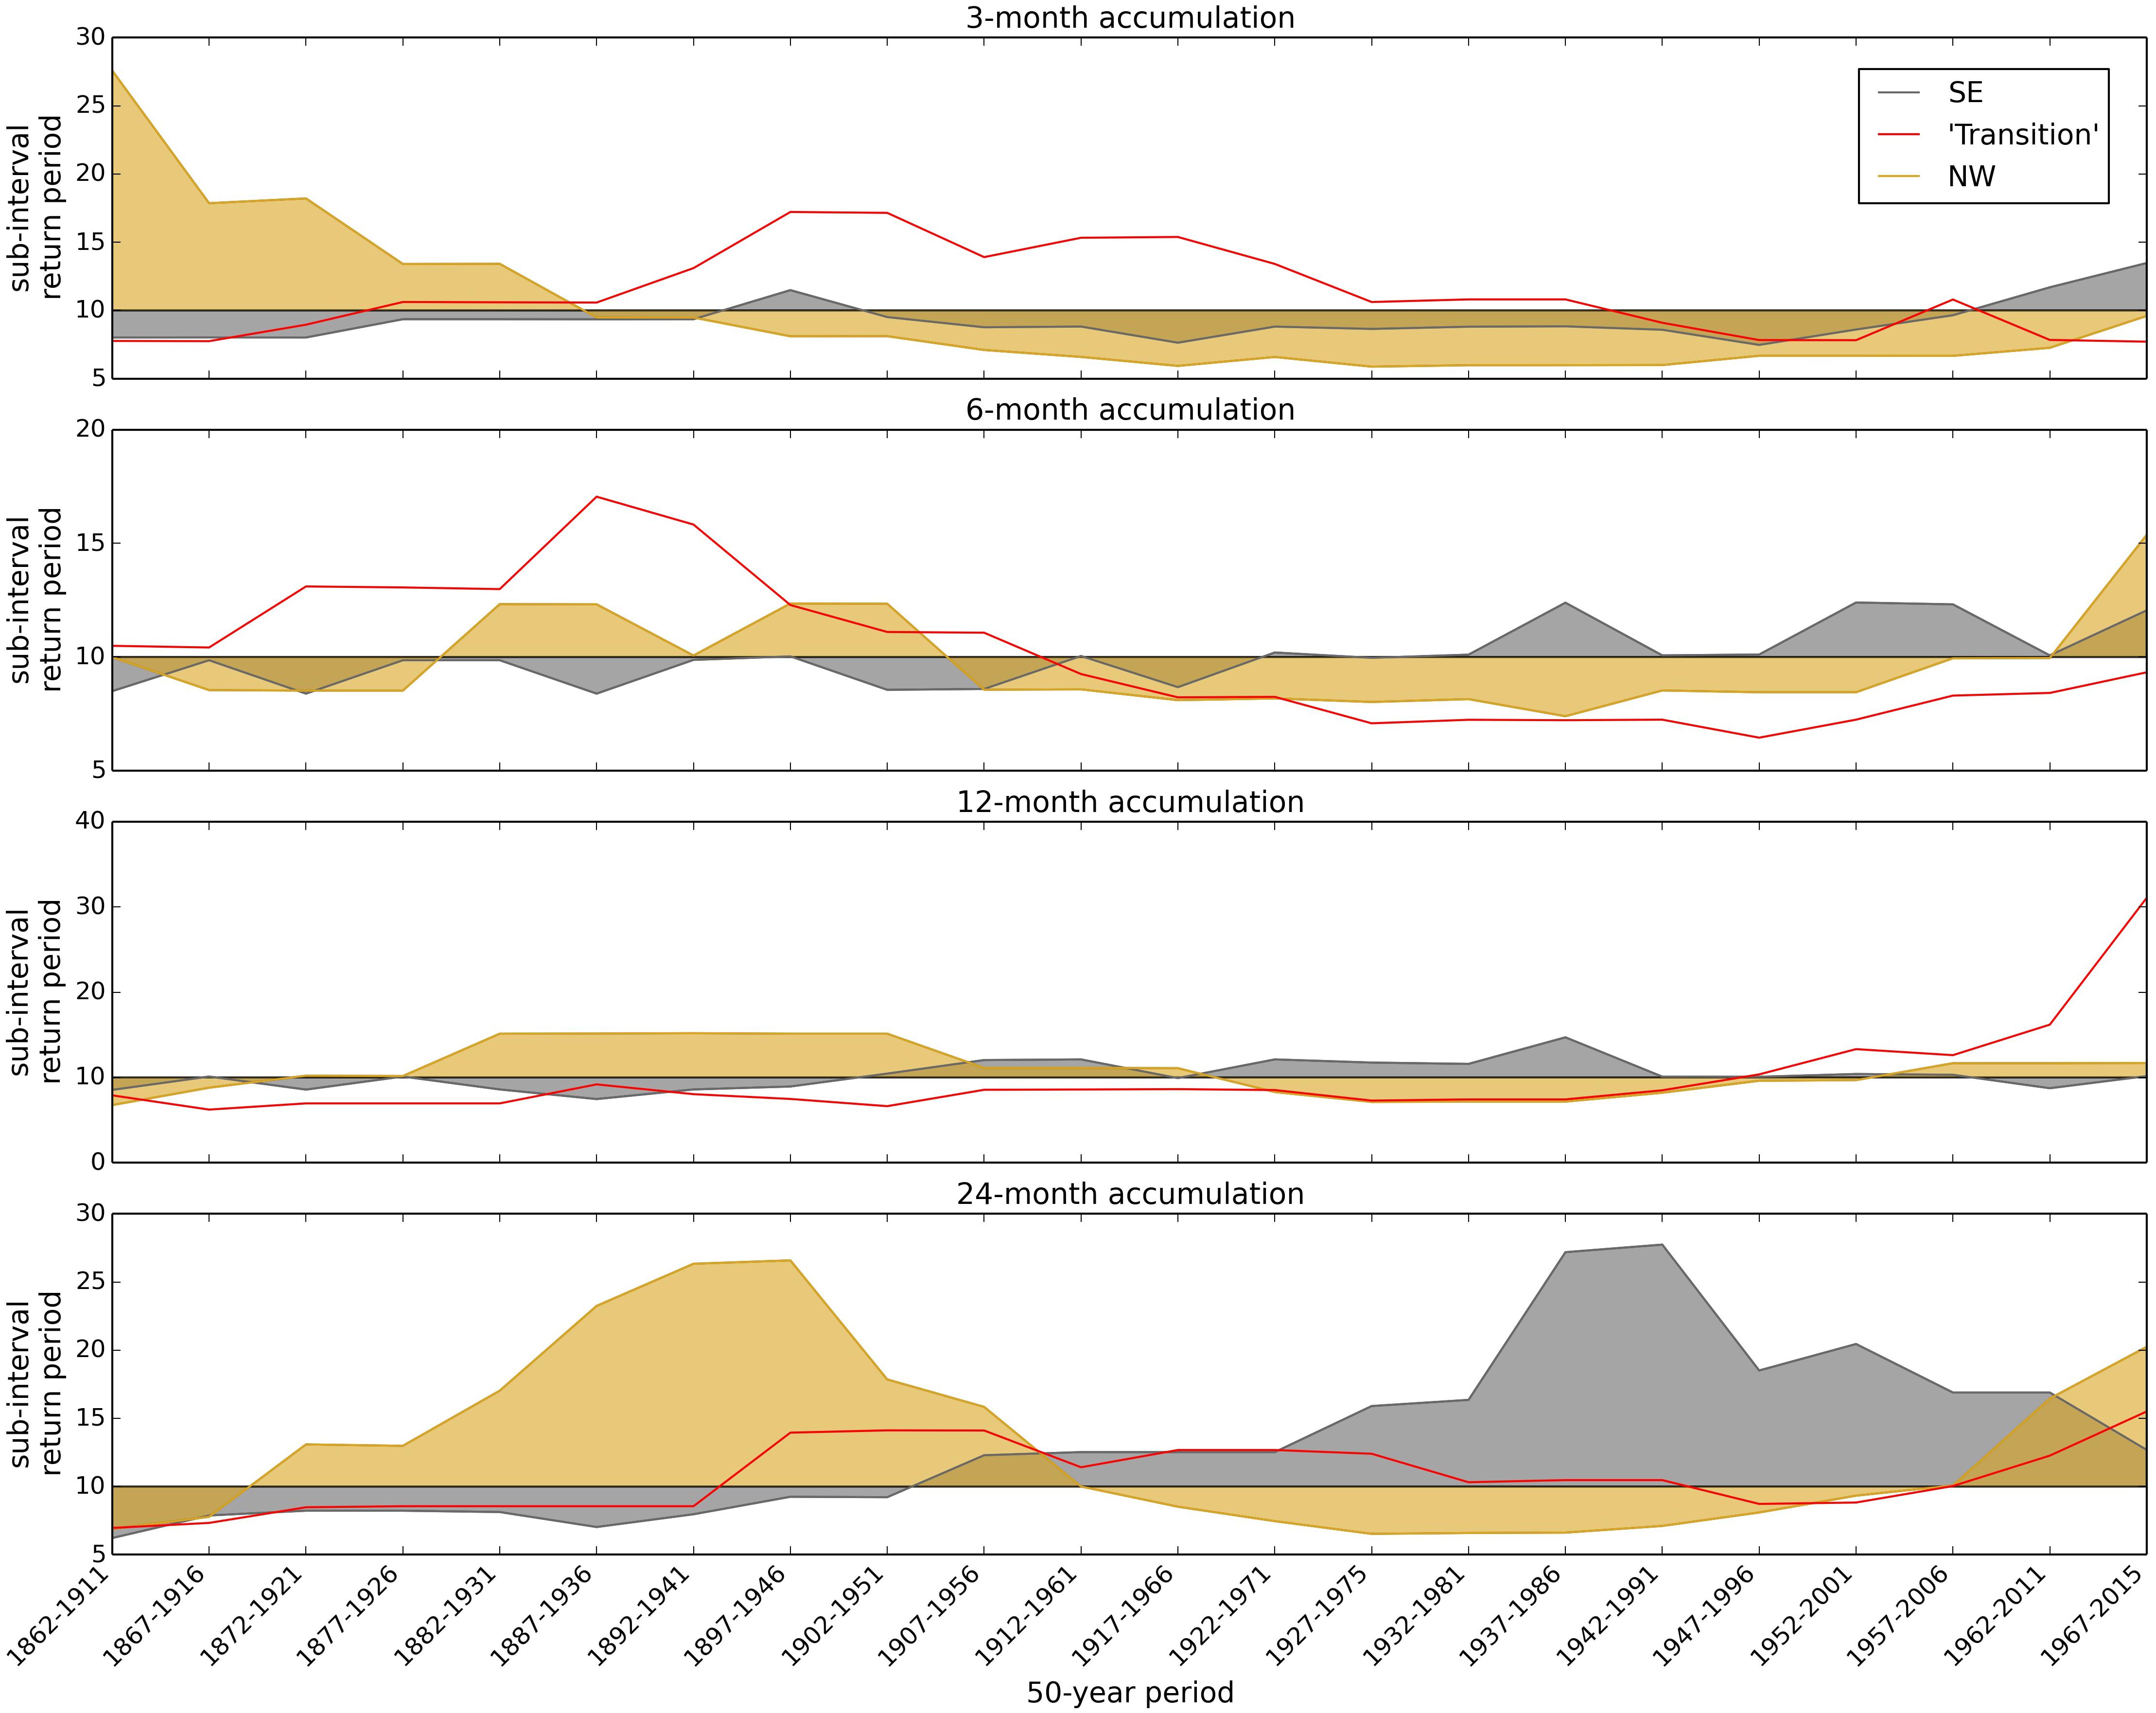
Figure 7. Temporal evolution of the “sub-interval return period” for a “global 10-year return level” as defined in Section “Data and Methods - Trend Analysis” for different 50-year time windows.
Droughts in SE and NW
Results in Figures 3, 4, 6 showed that droughts are more spatially extensive, longer and more severe in the SE than in the NW for short and medium accumulation periods, whereas the opposite is true for long accumulation period (24 months). These results are summarised and represented spatially in Figures 8, 9. Figure 8 shows for the most severe droughts (“top 20”) and for the four accumulation periods considered (3, 6, 12, and 24 months) the number of times each pixel belonged to the DCR of a drought event. We can see that the DCR of the most severe droughts are concentrated in the SE and “transition” regions, especially for short and medium accumulation periods. The most north-western part of GB shows particularly few occasions of belonging to the DCR of the most severe droughts.
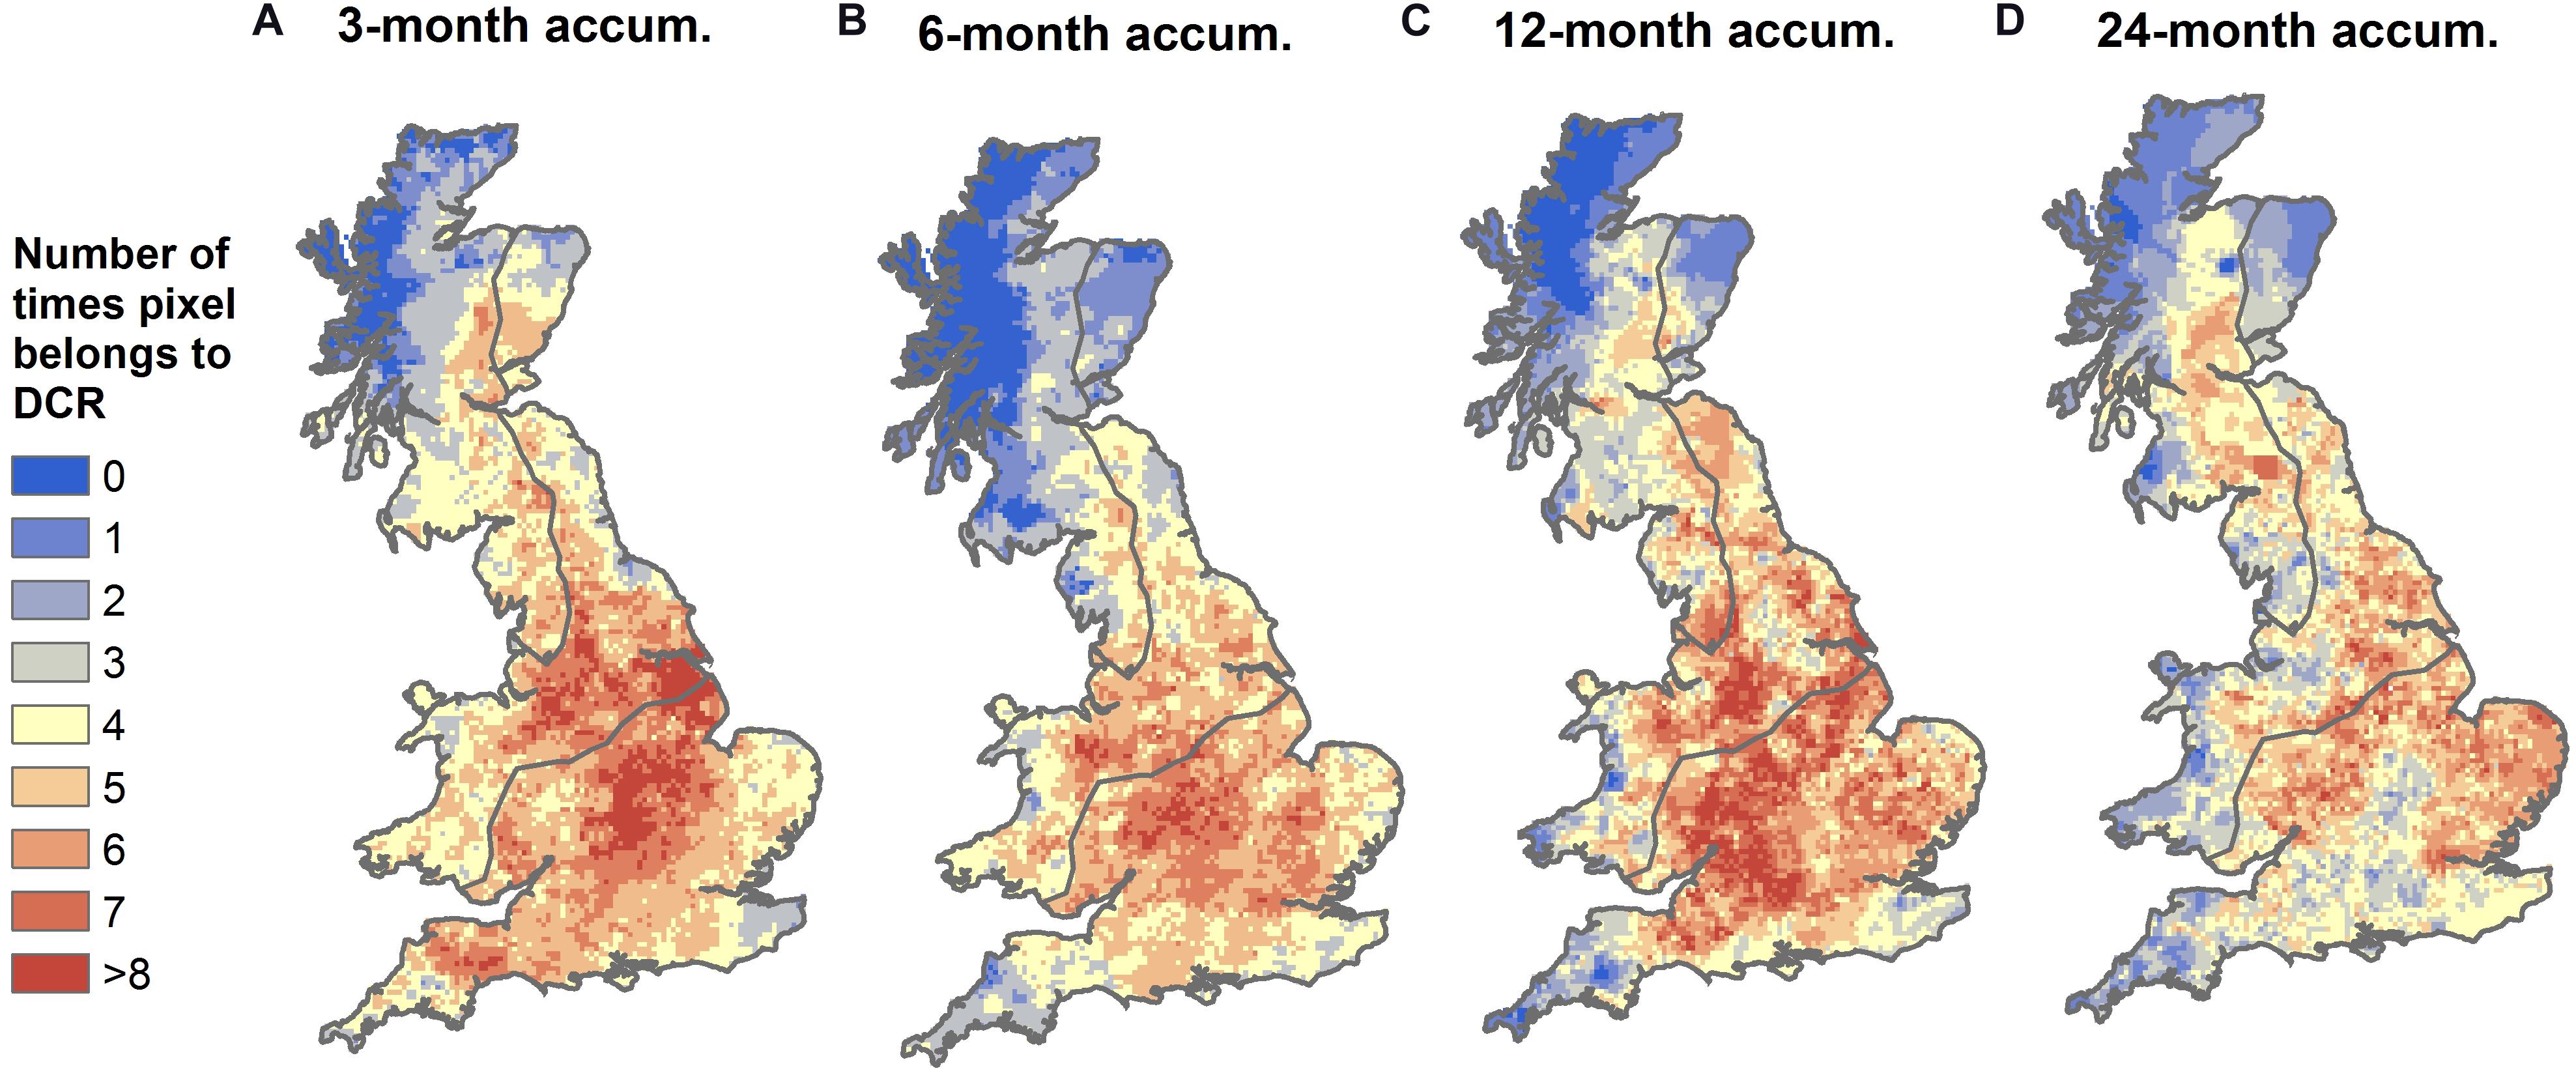
Figure 8. Number of times each pixel belonged to the DCR of a drought event in the top 20 drought events (based on severity) for accumulation periods of (A) 3 months, (B) 6 months (C) 12 months, and (D) 24 months.
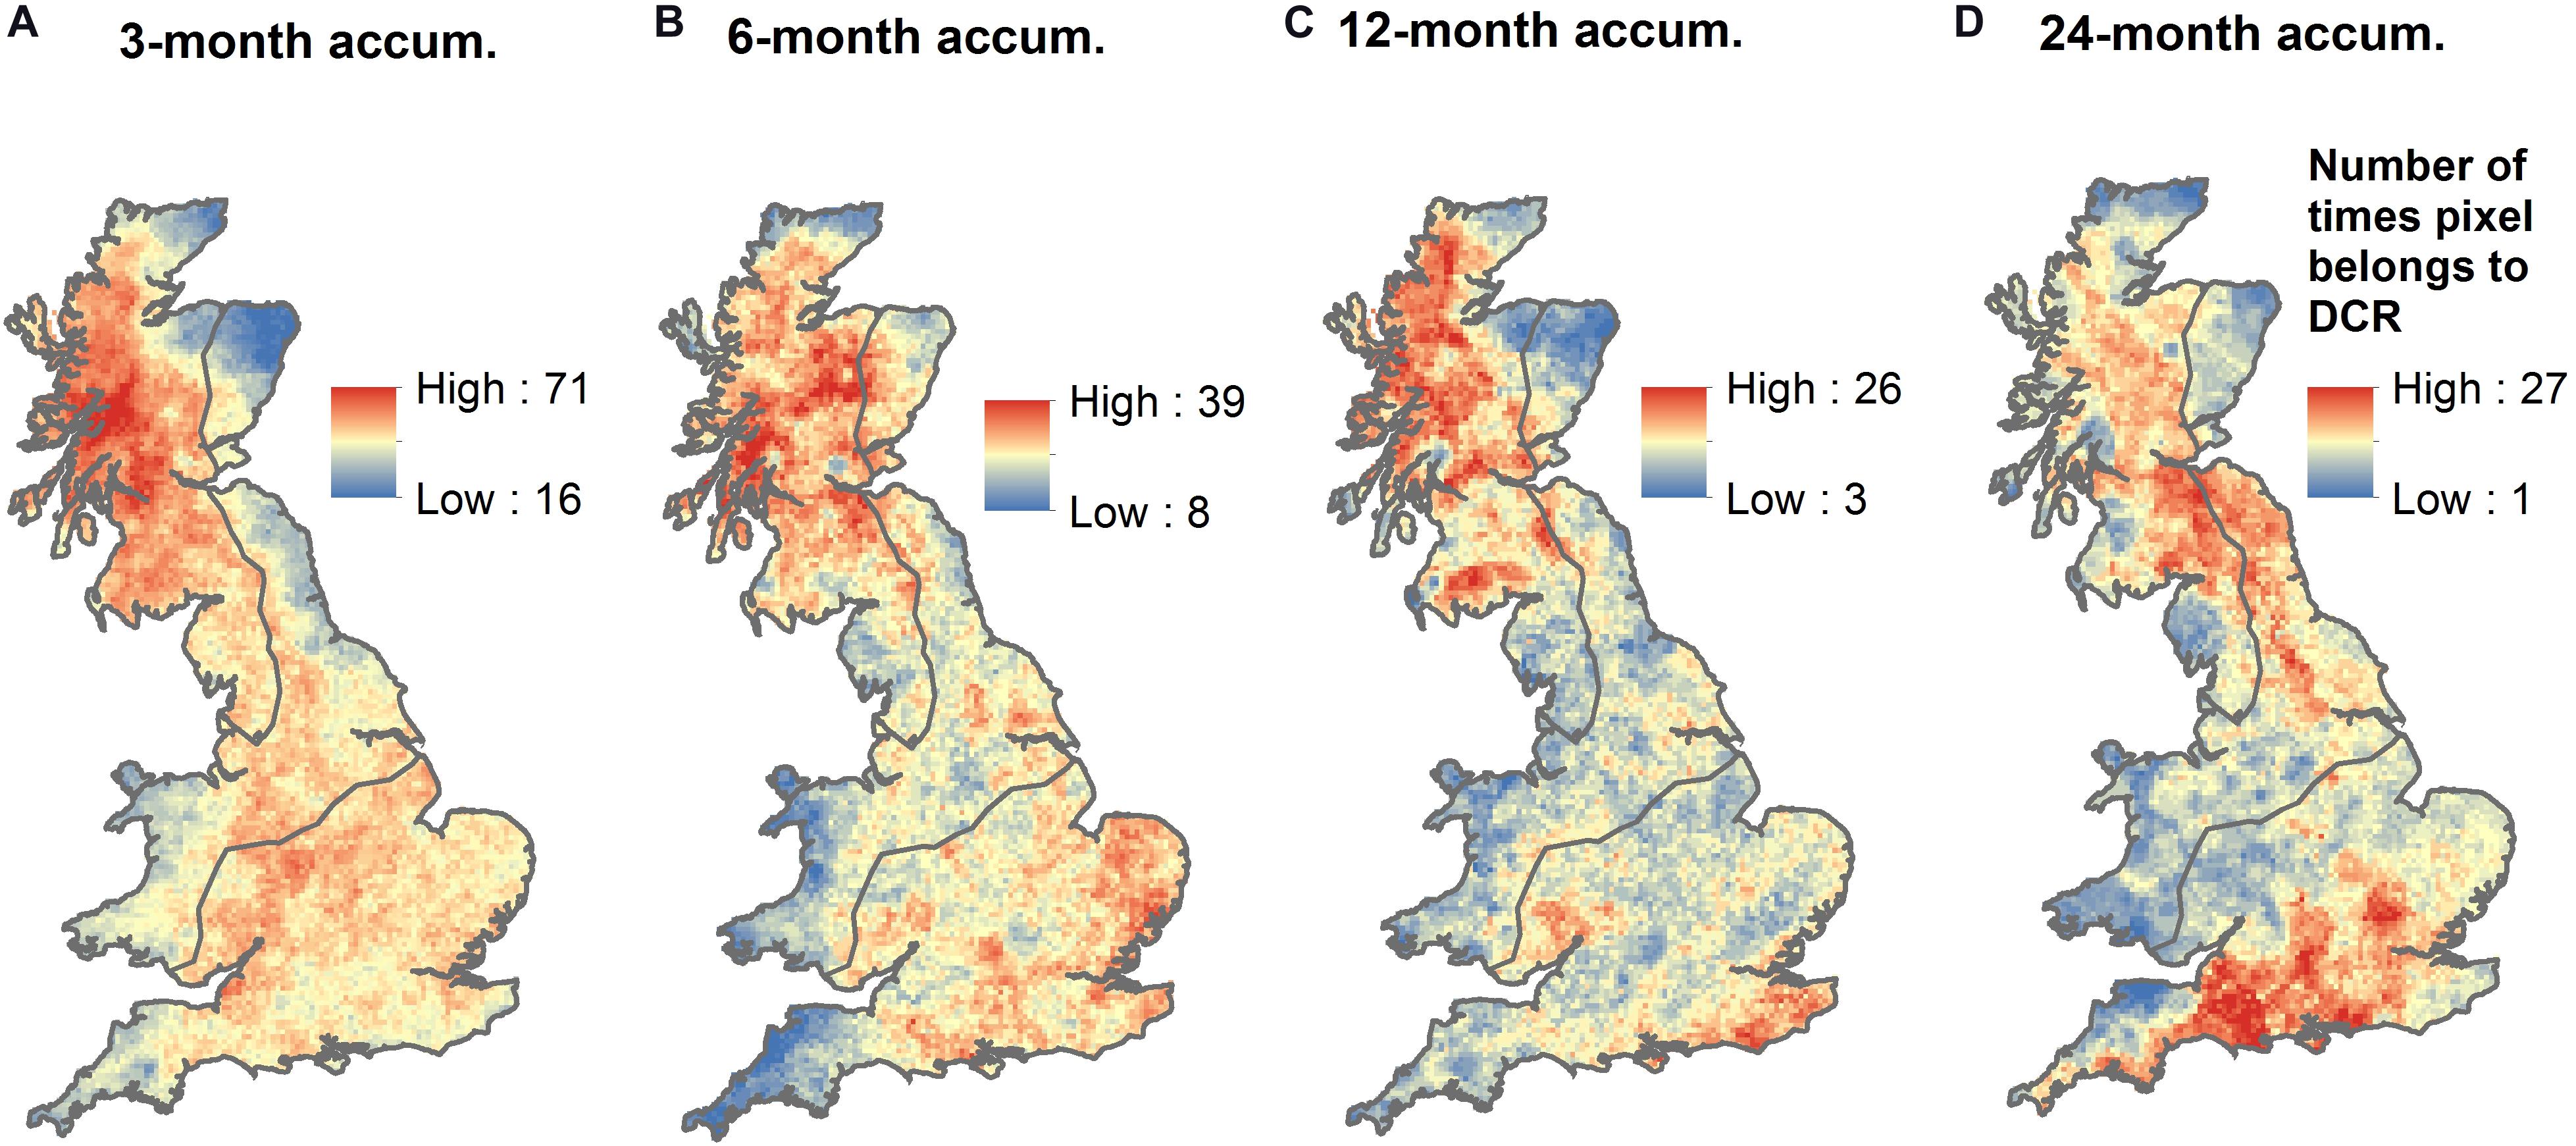
Figure 9. Number of times each pixel belonged to the DCR of a drought event in all drought events detected between 1862 and 2015 (based on severity) for accumulation periods of (A) 3 months, (B) 6 months, (C) 12 months, and (D) 24 months.
However, when all droughts are considered (Figure 9), the north-western part of GB is where the DCRs seem to concentrate, especially for short to medium accumulation periods, suggesting that this area experiences a large amount of less severe droughts compared to the SE. For the 24 months accumulation period, a second cluster of pixels belonging to DCRs located in the central part of southern England can also be observed, suggesting that this area also sees a large amount of less severe long-term droughts.
These geographical differences observed in the type of droughts (infrequent but severe vs. less severe but frequent) occurring in the SE and NW will have consequences for the challenges faced by water managers in each region. The droughts discussed so far are purely based on precipitation, but the impact that different type of meteorological droughts will have on water availability is closely linked to the hydrological properties of catchments in each region, which is discussed in Section “Discussion.”
Historic Timeline of Droughts
To identify long-term trends in droughts, the timing and location of detected drought events were explored. Figure 10 shows the “top 20” drought events based on severity. The plot shows simultaneously when the drought occurred (peak year on x axis and peak season on y axis, i.e. when the maximum mean intensity occurs), where it occurred (colour according to the region to which the event was assigned), and its ranking (size of the dot and number shown above the dot). We can see that the data rescue carried out by the Met Office United Kingdom in the earlier period (pre-1910) has allowed the identification and characterisation of some previously not well known severe droughts. As already shown by Figure 2, the majority of most severe droughts occurred in the SE for all accumulation periods, with particularly few observed in NW for the 6 months accumulation period.
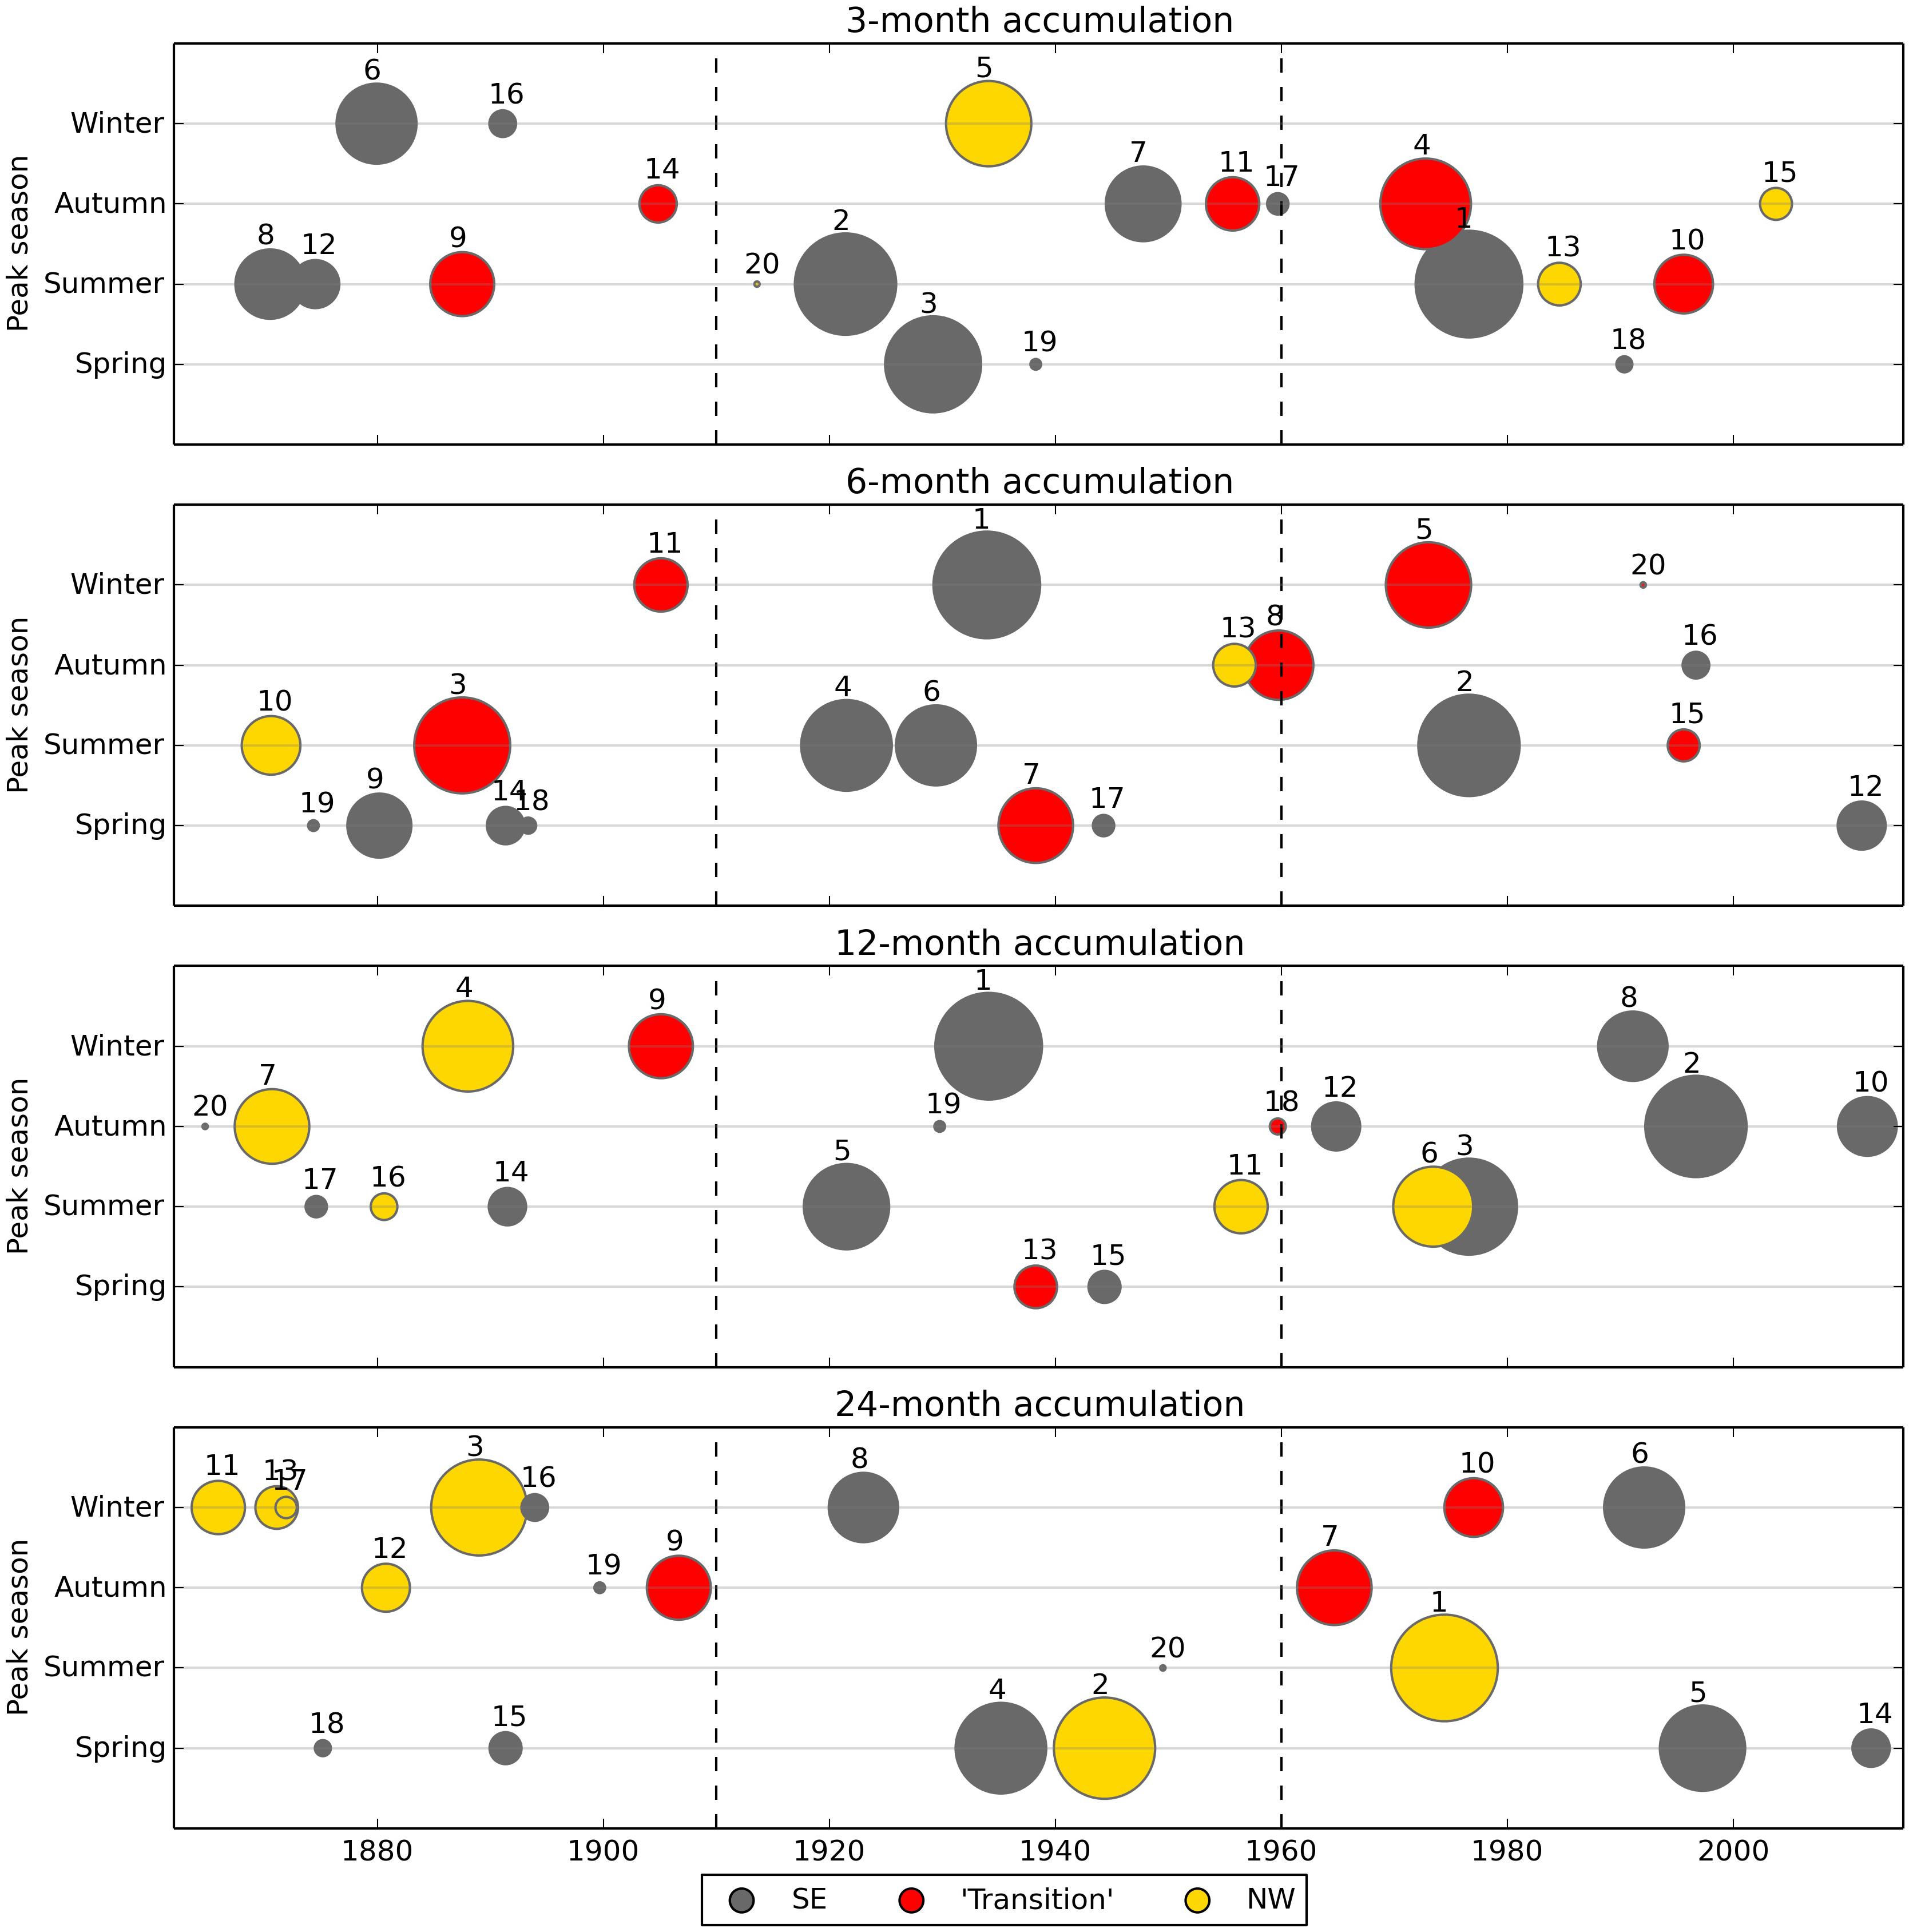
Figure 10. “Top 20” events based on severity for accumulation periods of 3, 6, 12, and 24 months (from top to bottom). The x axis shows the year of the peak of the drought (i.e., when the drought was most intense); the y axis shows the peak season of the drought event; the ranking is shown by the size of the dot (the bigger the dot, the more severe is the drought) and the number on top of each dot; and the colour of the dot indicates the region to which the drought event has been assigned.
However, for longer accumulation periods (12 and 24 months), the proportion of severe droughts occurring in the NW is higher (Figure 10). In fact, for these long accumulation periods there appears to be an alternation between severe droughts in the NW and the SE, with droughts in the SE occurring 1920–1940 and 1975–2000 and droughts in the NW occurring 1860–1900 and 1940–1975. This observed alternation echoes what was observed in Figure 7. Supplementary Figure 1 is similar to Figure 10, but shows the timeline of all drought events detected, instead of only the 20 most severe ones and also shows severe droughts switching between the SE and the NW.
Comparison With Major Droughts Reported in the Literature
When comparing the drought timeline shown in Figure 10 and Supplementary Figure 1 with previous studies, as expected we find many parallels, but also some differences. Marsh et al. (2007) synthetized a range of datasets from 1800 to 2006 to study and characterise past droughts in the United Kingdom (mainly qualitatively), and identified nine major droughts (going from 1890 to 1997). Jones and Lister (1998) identified one additional severe drought (1887–1888) earlier than Marsh et al. (2007)’s first major drought. Two further droughts were reported by the National Hydrological Monitoring Programme in the period posterior to Marsh et al. (2007)’s study (2004–2006 and 2010–2012 droughts). Barker et al. (2019) have subsequently identified three additional drought rich periods (hydrological droughts) which were not previously documented (1940–1949, 1960–1966 and 1968–1975). The Historic Droughts project has produced a drought inventory2 which brings together cross-sectoral descriptions of historic droughts and water scarcity in the United Kingdom. Table 1 shows a list of the droughts catalogued in the drought inventory [with the additional 1888–1887 drought from Jones and Lister (1998)’s work].
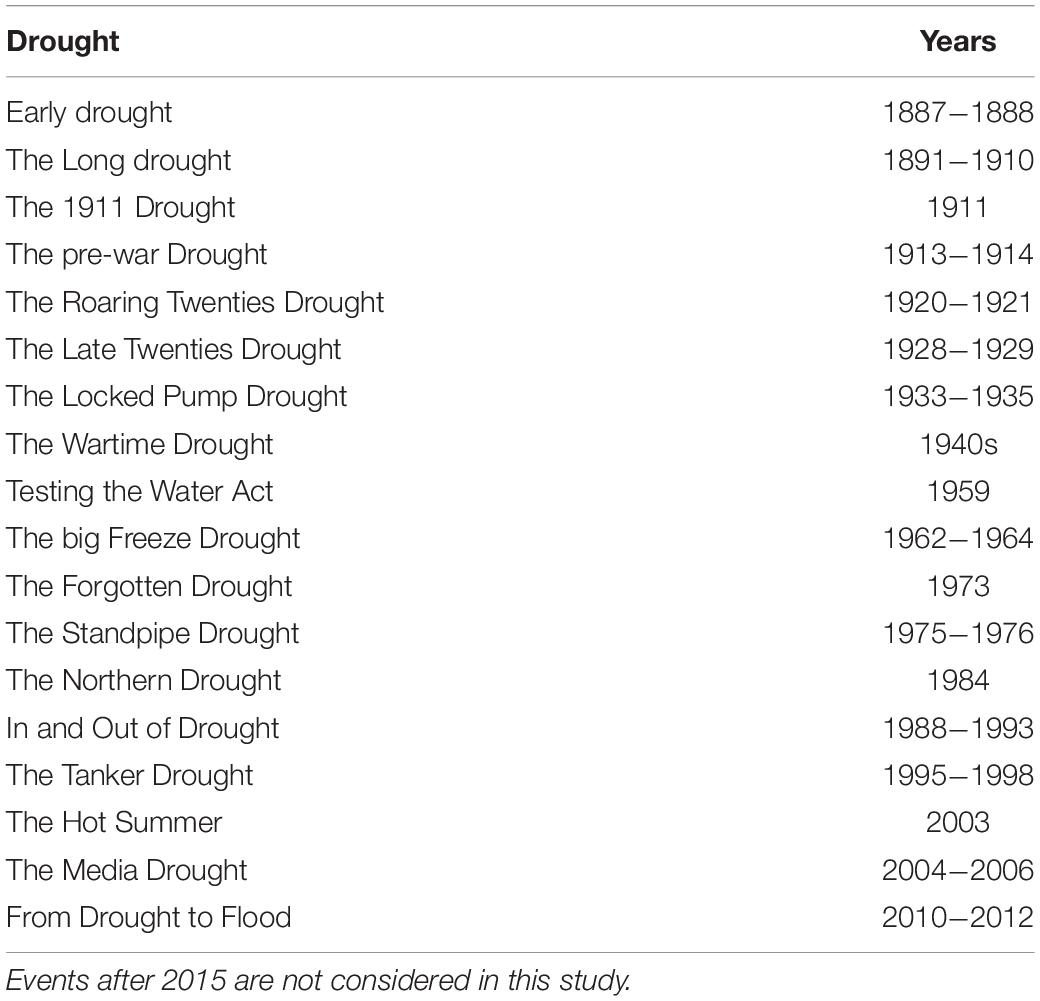
Table 1. List of droughts reported in the Historic Droughts Drought Inventory (https://historicdroughts.ceh.ac.uk/content/drought-inventory), with the additional early drought identified by Jones and Lister (1998).
Here we define an identified drought event as “major” if its rank in the historical record is within the 10 most severe droughts in at least one of the regions and for at least one of the accumulation periods (3, 6, 12, or 24 months).
Figure 11 lists all “major droughts” identified in our study following this criteria, and summarises the ranking based on drought severity for all regions and accumulation periods. All of the known past droughts from Table 1 can be found among these “major droughts,” with six additional ones also identified. The droughts previously reported (from Table 1) are marked in pink on the left hand side of Figure 11, whereas the newly identified ones are marked in blue.
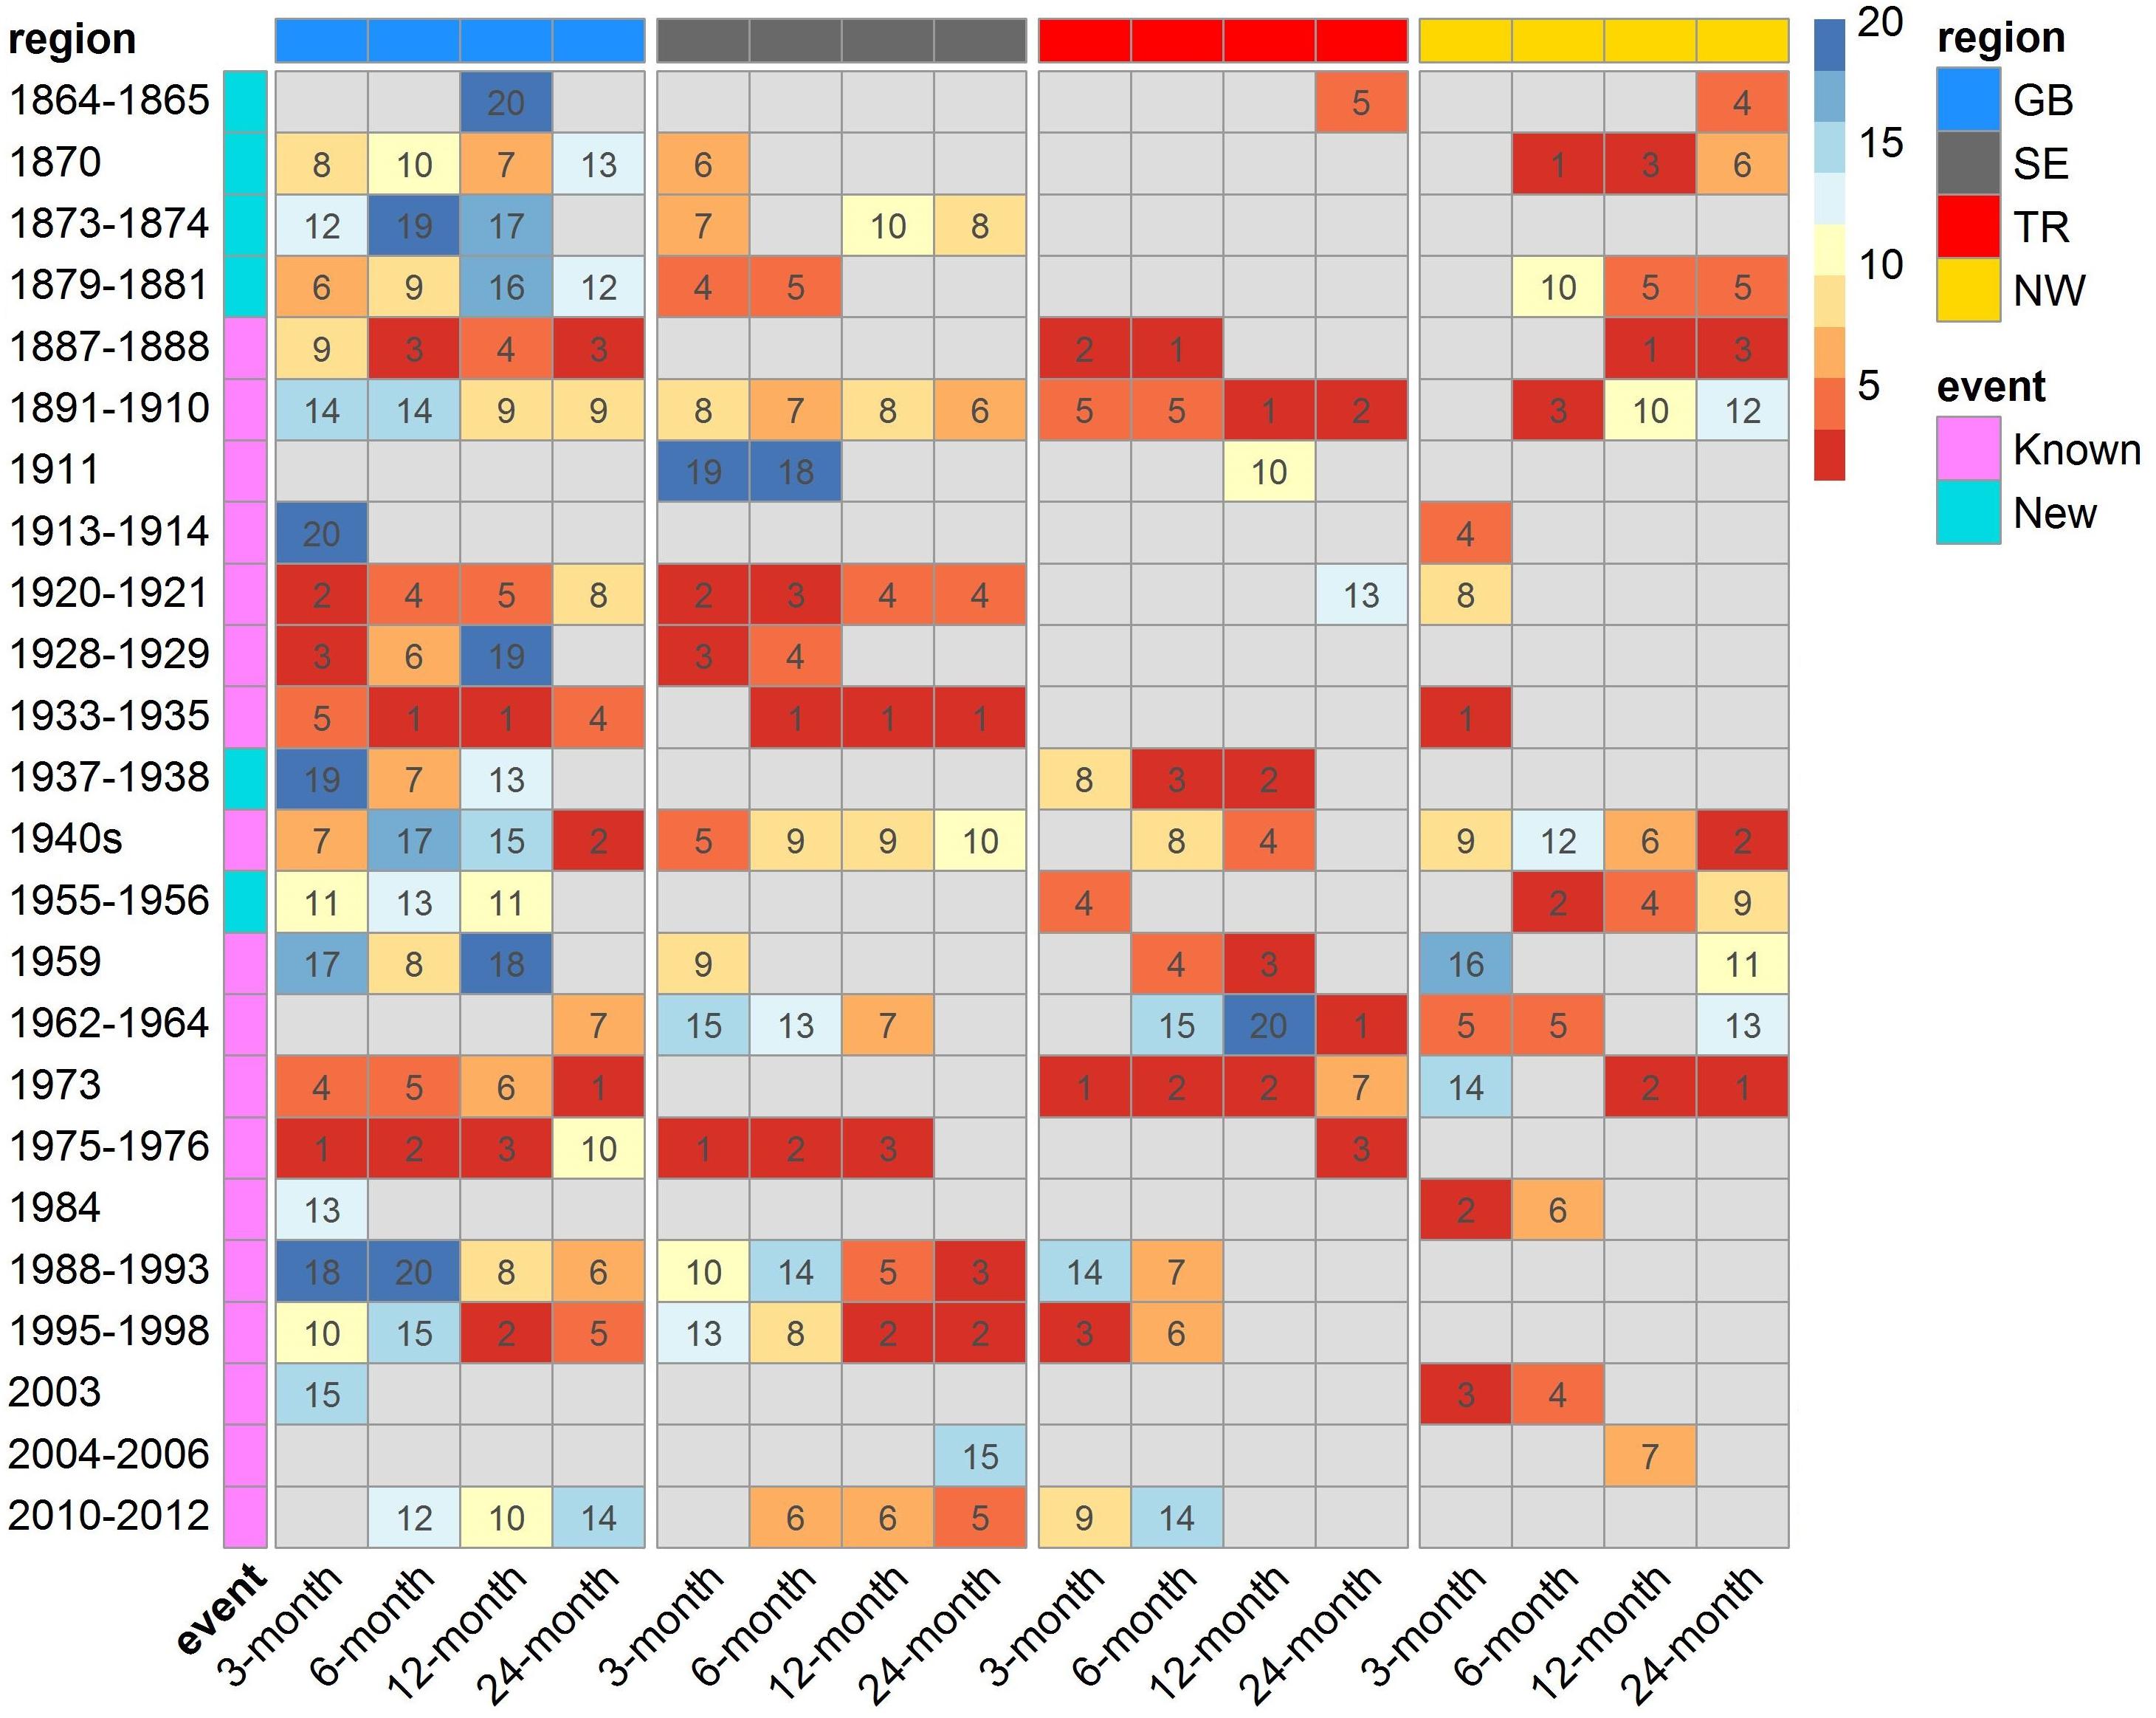
Figure 11. List of major droughts identified in this study. Each line in the plot corresponds to a major drought event identified in this study. The drought events marked in pink (on the left hand side of the plot) are major droughts previously reported in the literature, the ones marked in blue are new ones identified in this study. The plot is organised in four vertical blocks corresponding to Great Britain and the three regions (i.e., SE, Transition region, and NW). Each of these four blocks are in turn divided into four columns corresponding to the accumulation periods considered in this study (i.e., 3, 6, 12, and 24 months). The colour (and number) in each cell shows the ranking of the drought based on severity. For cells that are greyed out, the rank of the drought is greater than 20.
From the “major droughts” previously reported, the 1887–1888, the 1920–1921, the 1933–1935, the 1973 and the 1976 droughts are particularly severe at the national scale (GB), affecting multiple time scale with their rank being within the top 5 most severe droughts for more than one accumulation period. The 1933–1935 drought was particularly severe in the SE where it ranked as the most severe drought for the 6, 12, and 24 months accumulation periods. Although Jones and Lister (1998) used reconstructed river flows in England and Wales to identify the 1887–1888 drought, interestingly, it is the transition region (for short accumulation periods) and the NW region (for longer accumulation period) which are most affected by this drought. The 1929 drought affected the SE, and ranked highly (top 3) at national scale for short accumulation periods.
Some of the other known major droughts have a lower ranking at the national scale, but ranked highly regionally. For example, the 1891–1910 “Long Drought” affected the transition region more severely for long (12 and 24 months) accumulation periods and the NW region for mid-length (6 months) accumulation period. The 1940s drought affected more severely the NW for long accumulation periods, whereas the 1959 and 1962–1964 droughts mostly affected the transition region. The 1995–1998 drought affected the transition region for short accumulation periods and the SE for long accumulation periods. The 1988–1993 and the 2010–2012 droughts both mainly affected the SE. The 1984 and 2003 droughts both affect the NW region at 3- and 6-month accumulation period, ranking second and third most severe droughts respectively in that region. According to the methodology used here, the 2003 drought was more severe than the 2004–2006 drought.
The 1911, the 1913–1914 and the 2004–2006 droughts do not appear as severe as the rest of the “major” droughts using our methodology. The 1911 drought only affects the transition region at 12-month accumulation period, whereas the 1913–1914 drought was only severe at short accumulation period (3-month) for the NW. As to the 2004–2006 drought, it is only in the NW for 6-month accumulation period that it ranks as the 7th most severe droughts. This observation is discussed further in Section “Historic Droughts.”
Six new “major” droughts were identified in this study:
- A cluster of four droughts from 1864 to 1881, with the 1870 one particularly severe in the NW (number one drought for the 6-months accumulation period). This illustrates the value added by the newly digitised historic raingauge data which has allowed the extension of the precipitation data back to 1862, although caution is required when interpreting these results due to data uncertainties as discussed in Section “Uncertainties in the Data.”
- The 1937–1938 drought was severe in the transition region, and
- The 1955–1956 drought affected the transition region for short accumulation period and NW for medium and long accumulation period.
Synchronisation of Droughts Between Regions
The final research question aimed at looking at how often different regions are simultaneously in drought. This can be two distinct droughts occurring simultaneously in two regions, or the same drought affecting various regions. Whenever a drought assigned to a given region had at least 25% of its extent in another region, this second region was considered to be “affected” by said drought. Note that the threshold 25% is arbitrary and a different value could have been chosen.
Figure 12 shows the percentage of months in drought where only one region was in drought, or multiple regions were in drought simultaneously. The hatched areas in the stacked bars represent months where drought was occurring simultaneously in multiple regions, whereas the non-hatched areas show the months where drought was occurring in a single region. It shows that most SE droughts also affect the Transition region, which is not that surprising, as in the initial clustering based on precipitation with two regions only (as described in Section “Geographical Clustering”), these two regions (SE and Transition) belonged to one single region. It also shows that a significant proportion of droughts affect all three regions simultaneously. For example, if we look at the 3-month accumulation period (first stacked bar in Figure 12), all three regions were simultaneously affected in 16% of all months in drought. When the SE is in drought, in 31% of the cases the NW is also in drought ([intersection between SE and NW]/[total of SE]∗100 = [16+2]/[16+24+16+2]∗100). When the NW is in drought, 36% of the time the SE is also in drought ([intersection between SE and NW]/[total of NW]∗100 = [16+2]/[16+2+8+24]∗100).
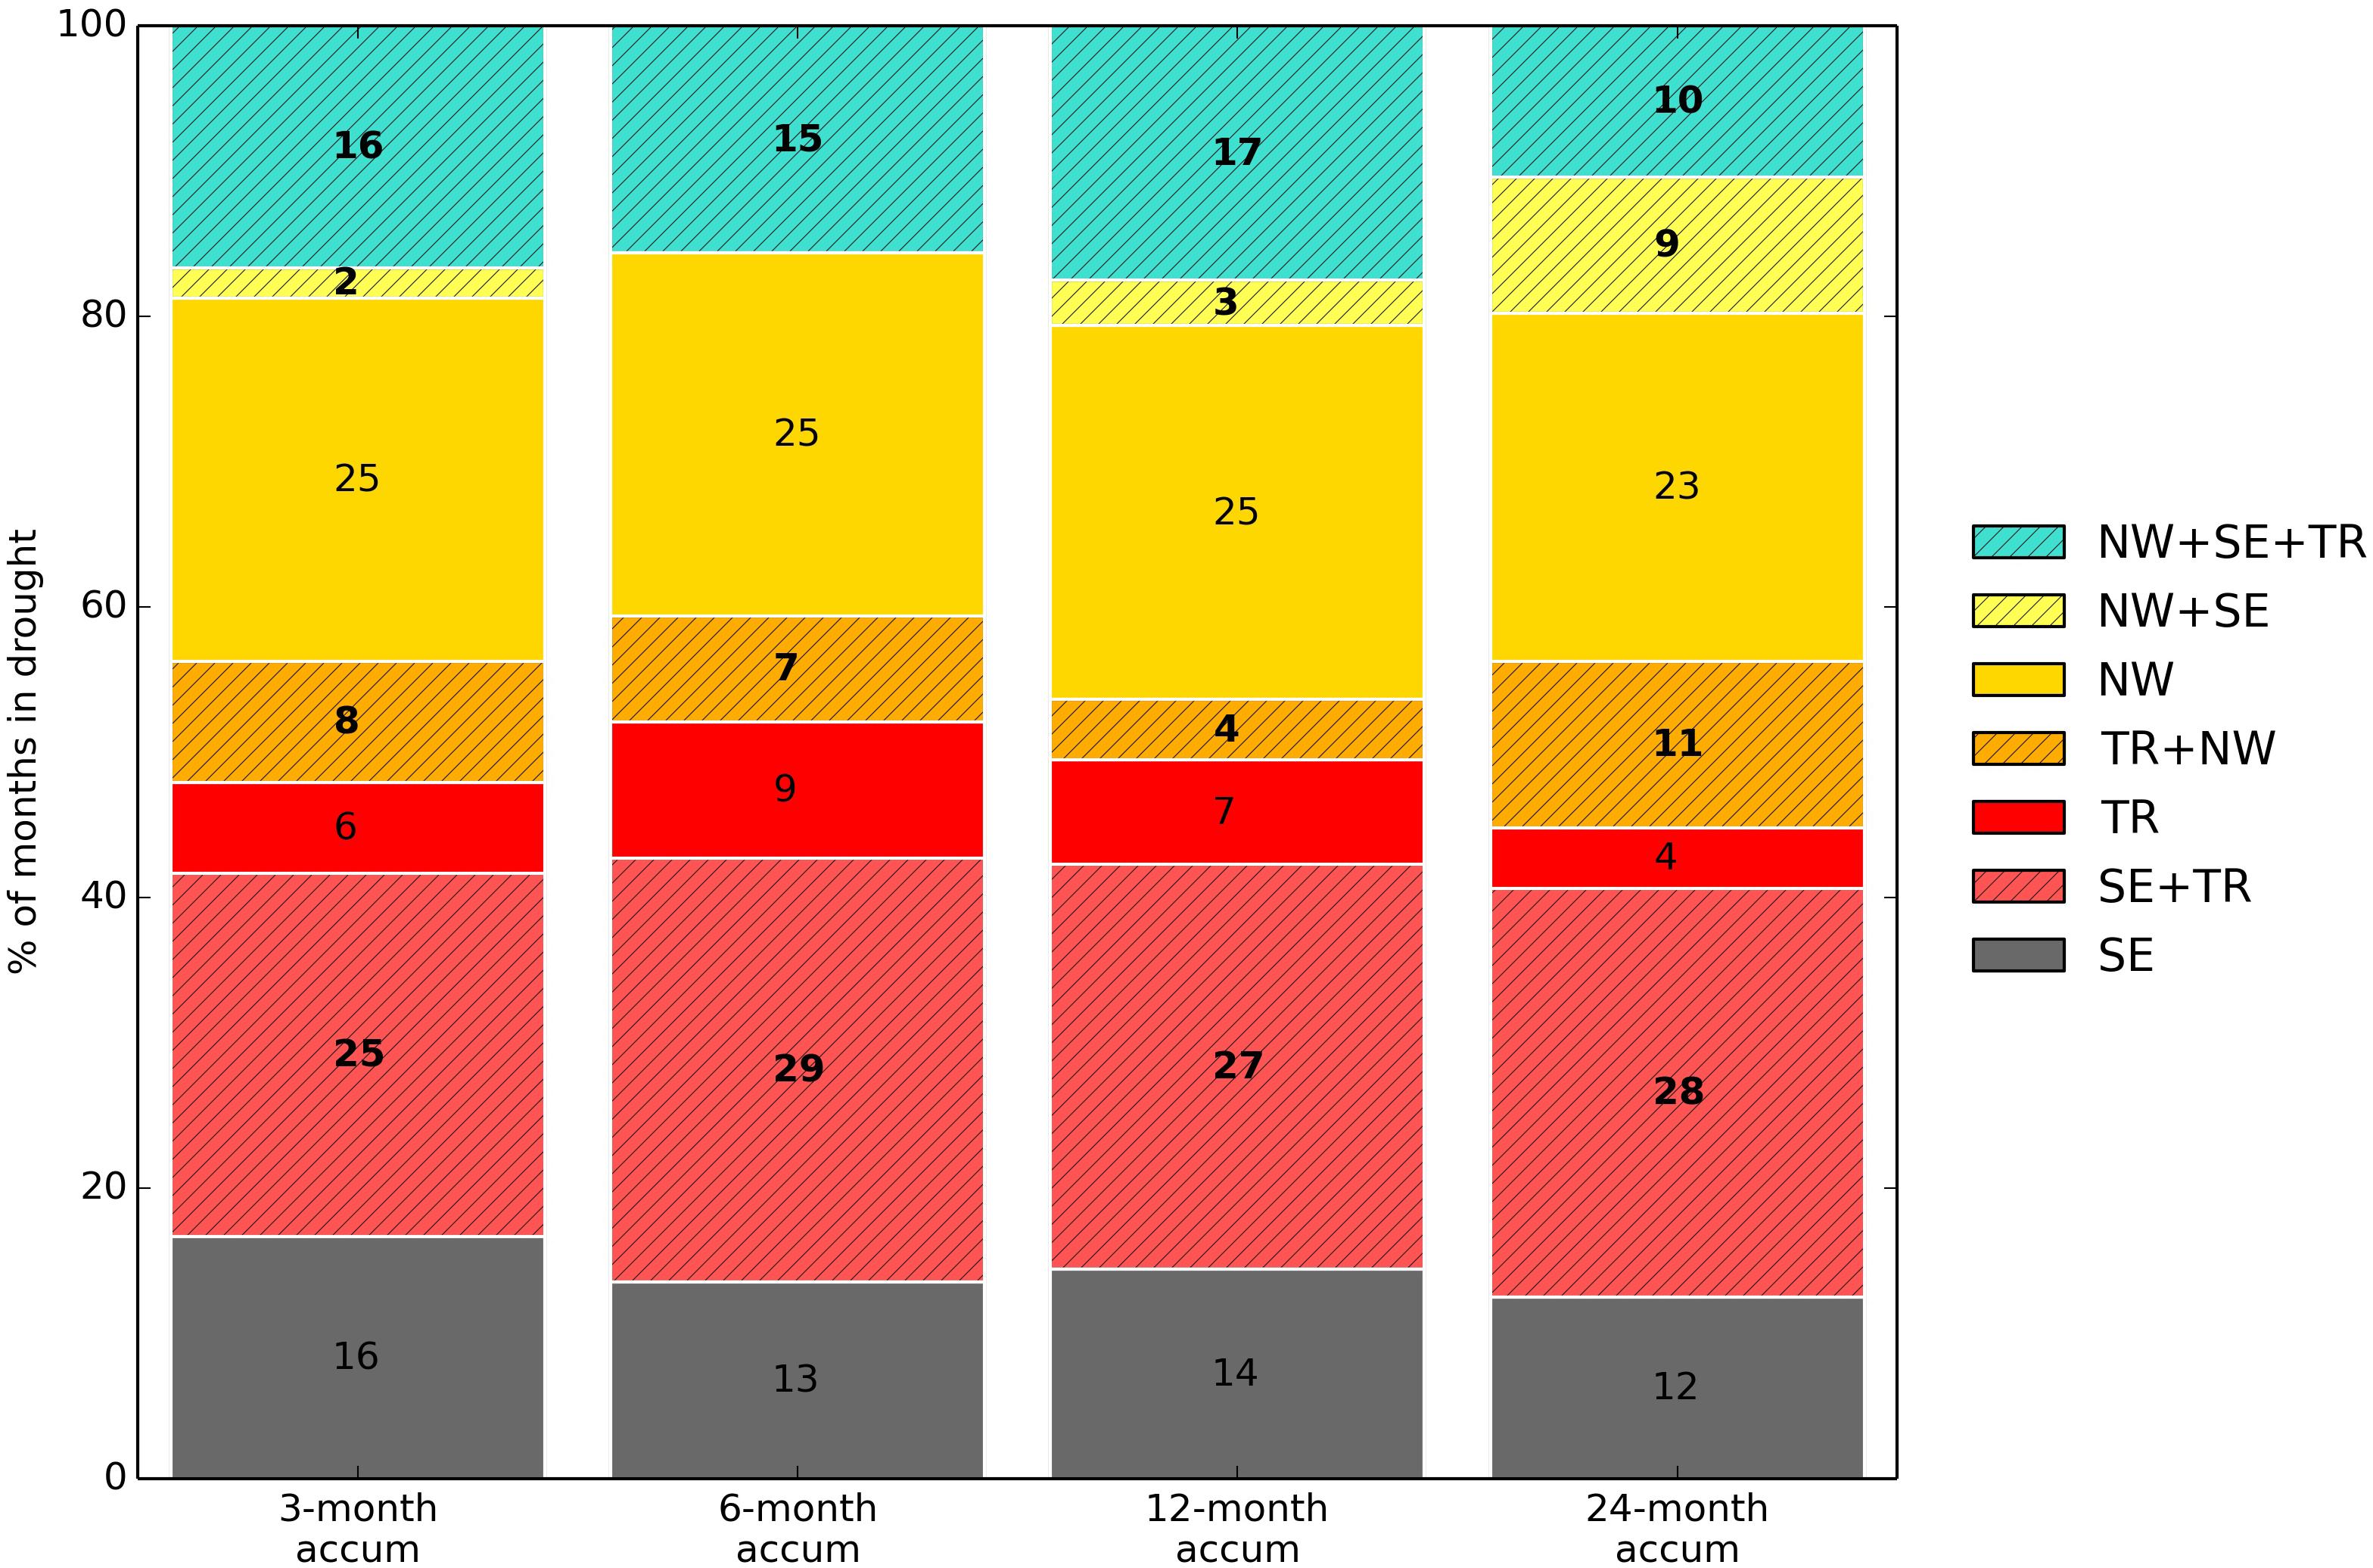
Figure 12. Percentage of months in drought affecting the three regions. The hatched area represents months in drought where multiple regions were affected simultaneously. “TR” in the legend stands for the Transition region. This includes all drought events detected between 1862 and 2015, for accumulation periods of 3, 6, 12, and 24 months.
In Figure 13, only the “top 20” most severe droughts in each region were selected, the results look quite different to when all events are considered (as shown in Figure 12). We can see that when only the most severe events are considered, there is very little overlap between the NW and the SE. This means that when the SE is in an extremely severe drought, very rarely is the NW also in a drought at the same time, and vice-versa. The Transition region, however, is often affected by severe droughts at the same time as one of the other regions.
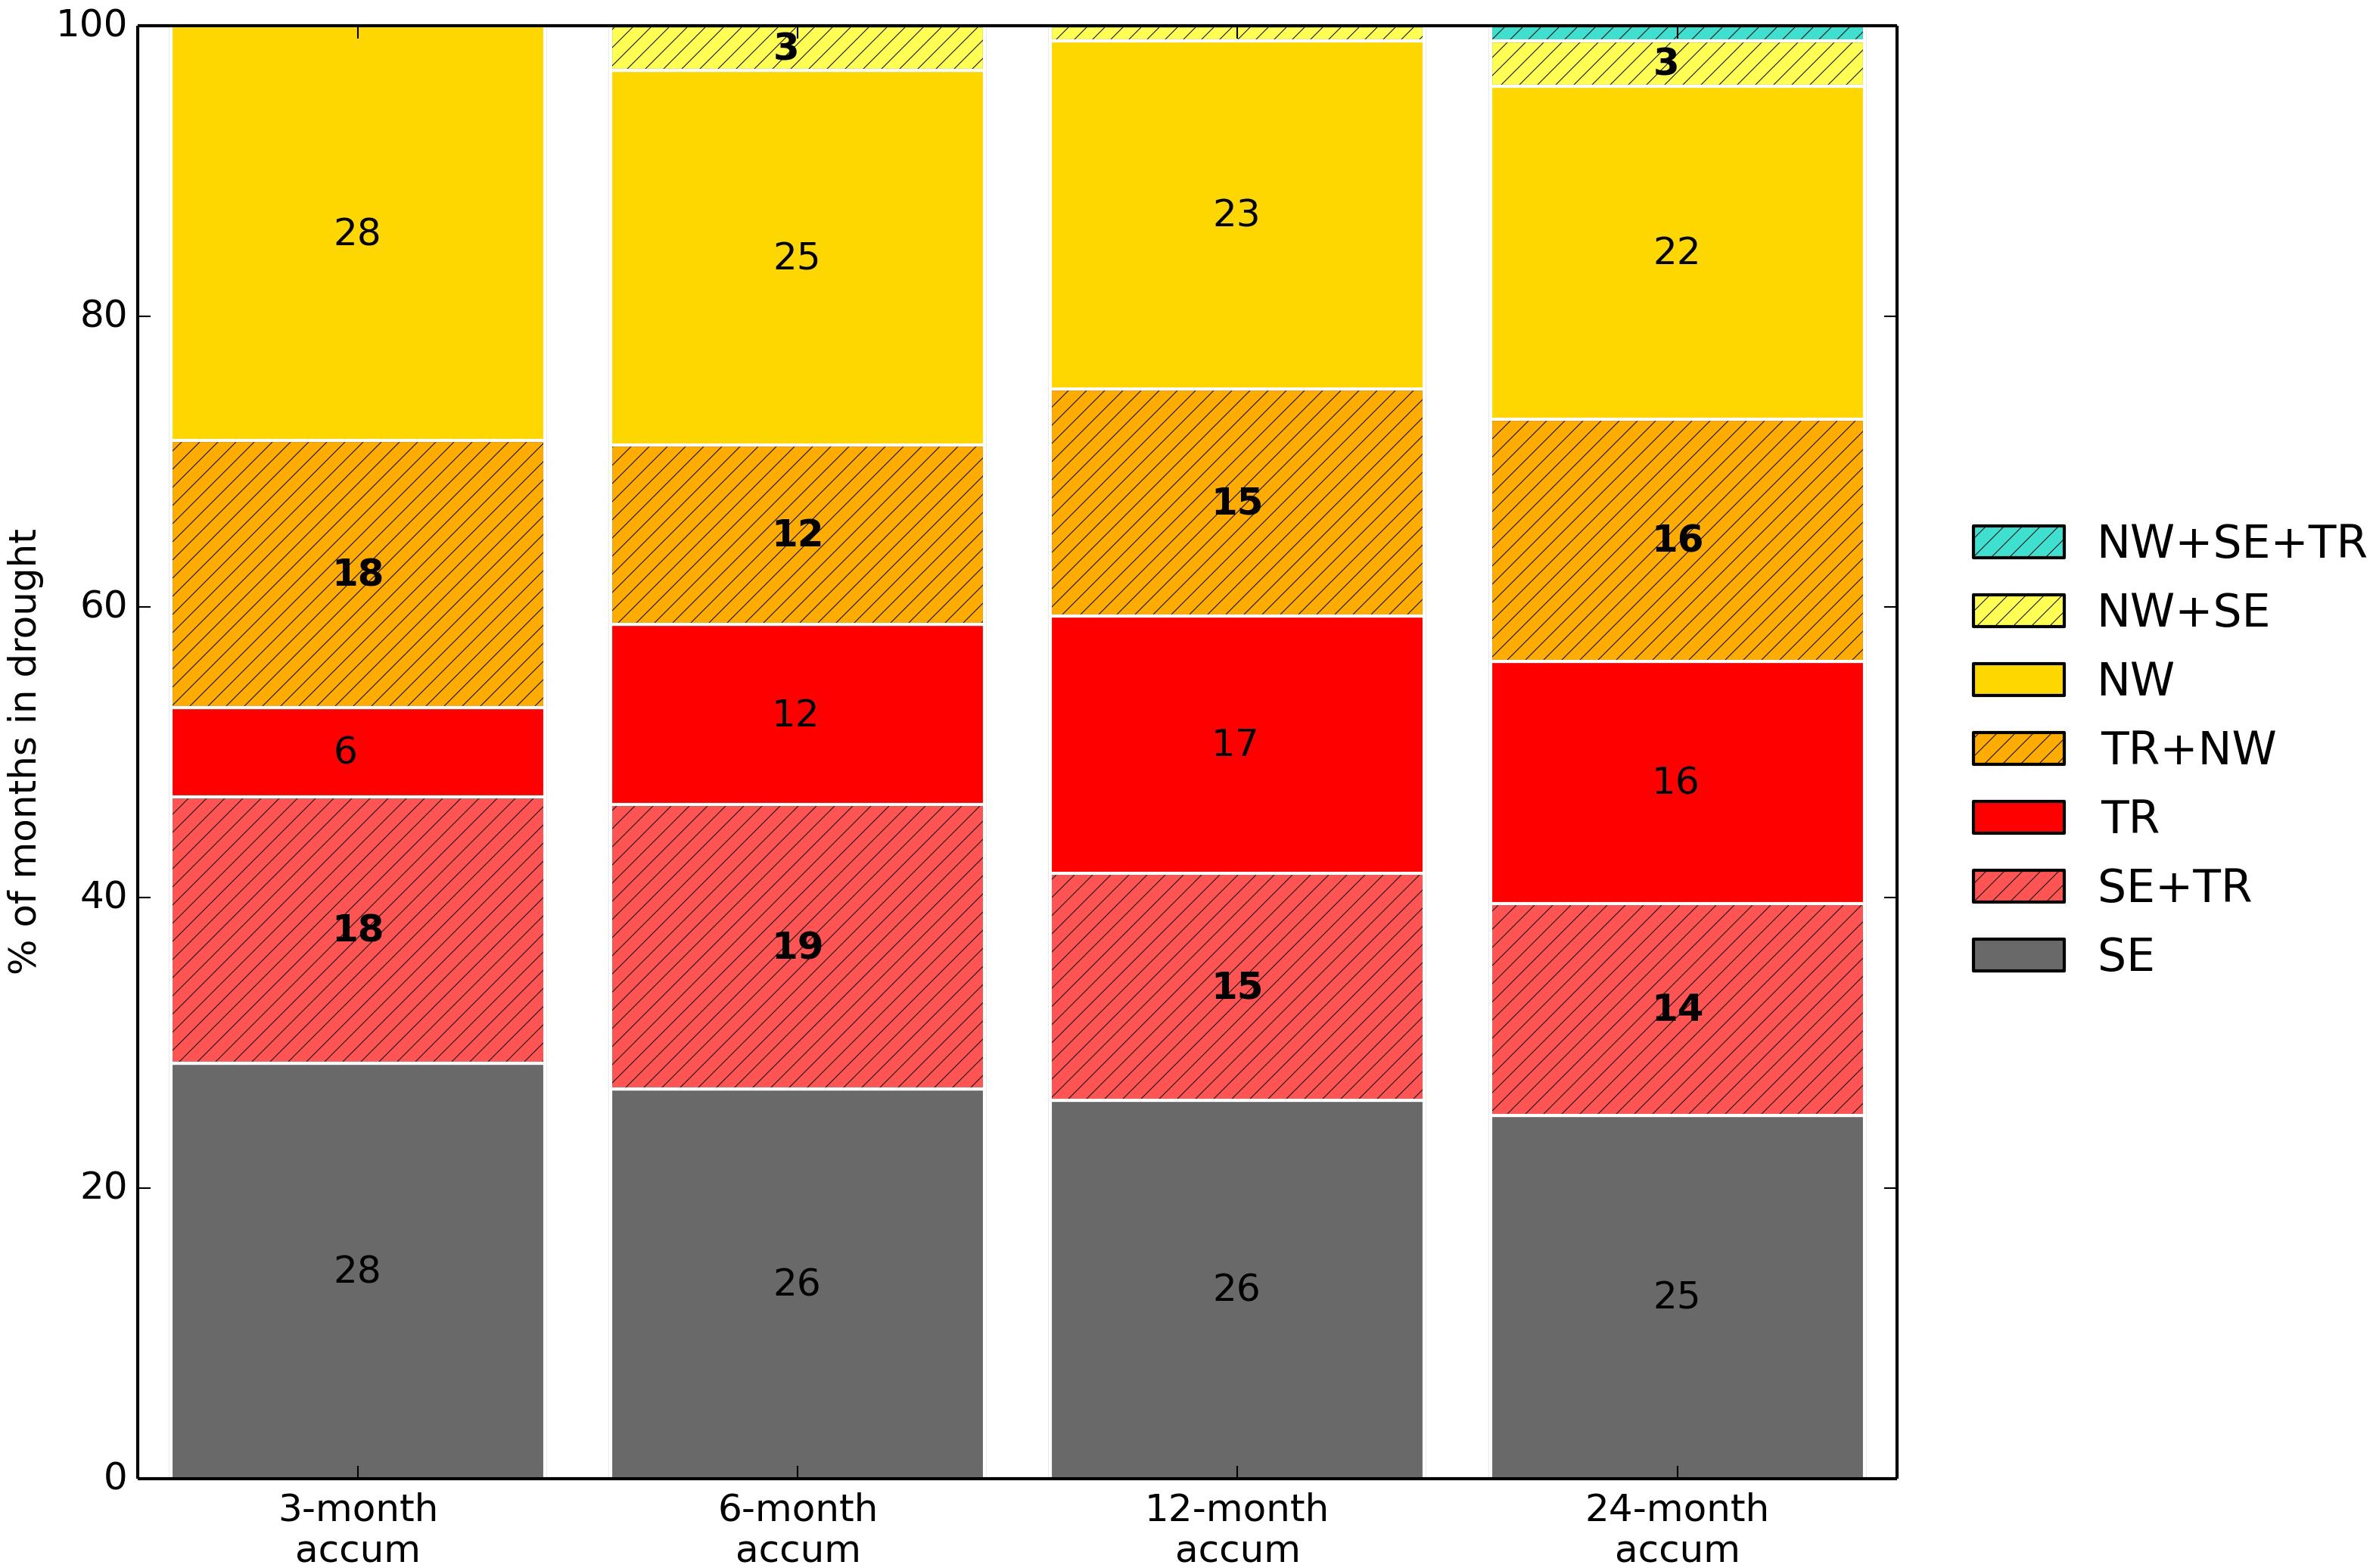
Figure 13. Percentage of months in the most severe droughts affecting the three regions. The hatched area represents months in drought where multiple regions were affected simultaneously. “TR” in the legend stands for the Transition region. The “top 20” most severe droughts detected between 1862 and 2015 in each region were considered, for accumulation periods of 3, 6, 12 and 24 months.
Discussion
Precipitation over Great Britain is characterised by large disparities in absolute precipitation between the NW and SE. There are also significant differences in variability. However, droughts are generally seen as a deviation from the norm, and in this study we therefore extract drought events below a particular quantile threshold (= 0.2), which makes comparisons between regions possible. We take the approach of extracting droughts as a spatiotemporal feature from high-resolution gridded data, enabling us to look at area, duration, intensity and severity. Using these characteristics of the extracted events, we were able to compare past droughts between the regions.
To our knowledge, this is the first study for Great Britain to derive drought events independently from spatial boundaries and without fixing any temporal window. This is unique as we allow space and time to vary freely to self-define the droughts, although for the purposes of visualising drought occurrence, frequency and characteristics, we also classify these events as belonging to one of three regions, allowing us also to look at synchronicity of drought occurrence between regions.
In this section, we first reflect on the uncertainties in the data and how these should be carefully considered when interpreting the results. We then discuss the results including their implication from a water management point of view focusing on (i) historic droughts, (ii) the differences in drought characteristics between regions, and (iii) the spatial coherence of droughts.
Uncertainties in the Data
As mentioned in Section “Data,” thanks to the data rescue and digitisation efforts from the Met Office within the Historic Droughts project, a substantial increase in monthly raingauge density was achieved in the earlier period of the data (1862–1910), where over 200 monthly gauges were added to the network (MetOffice, 2019, 2020). However, despite this significant increase in number of raingauges, the network is still much denser from 1961 onwards compared with pre-1961, where there is a jump from 526 stations to 4259 across Great Britain. The current network comprises around 2700 raingauges. It is therefore important to consider the uncertainties caused by the density of the raingauges used to derive the underpinning gridded rainfall data used here, especially in the earlier period.
To address this issue, Legg (2015) extensively analysed the effect of thinning the raingauge network density on the uncertainties in the derived gridded precipitation product. They concluded that the interpolation error increases only slowly as more stations are removed from the network. From their analysis, the increase in root-mean-square errors (RMSE) when comparing the current raingauge network density (∼2700 raingauges) with the network during the earliest period (∼250 raingauges) would go from about RMSE≈16 mm to RMSE≈23 mm on average which is considered an acceptable increase in the error. The Met Office has digitised enough new raingauge data in the earlier period to keep the error in the precipitation grids within an admissible level.
However, additional caution is required when considering results in the NW, as the drop in density of raingauges prior to 1961 is more dramatic in Scotland than elsewhere in GB. In addition, Scotland is also one of the areas of GB displaying the largest variability in precipitation. Supplementary Figure 2 shows the spatial distribution of the raingauge network collated by the Met Office just before the large jump in number of raingauges (in 1960) and immediately after (in 1961). We can see that the density of the network is particularly affected in Scotland, and to a lesser extend in Wales, the north-east and central England. Therefore, when looking at spatial extent of droughts before 1961, it is possible we see a false signal of greater drought coherence in the NW due to scarceness of raingauges resulting in less spatial detail in the rainfall pattern. As a result, there is a risk of overestimating the drought area in that region, and consequently, the severity of droughts prior to 1960, and increasingly so as we go back in time, as the density of raingauges decreases.
In addition to the question of the raingauge network density, the degree of confidence we can have in the actual raingauge data quality – particularly for the earlier period in some remote areas such as the Scottish highlands – is to be carefully considered. The earlier instruments were installed before international standards for precipitation measurements were defined and widely adopted (Rodda and Dixon, 2012), and issues such as snowfall under-catch in winter or the effect of wind are likely to overestimate the severity of droughts. However, Murphy et al. (2020) found that winter under-catch was identified as being significant mainly for data prior to 1850 in the British Isles, and that observed and reconstructed precipitation time series strongly agreed for the period going from 1870 to present. This gives us confidence in the underlying raingauge data underpinning the gridded dataset used in this study, which starts in 1862, and although we acknowledge the greater uncertainty in the data in the earlier period, this is the best dataset available at the time this study was carried out and is a clear improvement to what was available before.
Historic Droughts
As we would expect, most of the severe droughts previously reported in the literature (Table 1) were picked up as major droughts in our study; well-known droughts such as the 1976 and the 1933–35 droughts ranked highly in the results. However, there are a few exceptions: the 1911, the 1913–1914 and the 2004–2006 droughts (Figure 11) are not found to be exceptionally severe here. The apparent lack of severity for these particular events – despite having historical evidence of drought impacts (as illustrated in the drought inventory) and having been identified as a severe event by other methodologies (e.g., Barker et al., 2019) – could be explained by the inherent nature of the methodology used. Here the method is based on a connectivity approach, where the pixels identified as being in drought must be contiguous, and the area between two consecutive time-steps must overlap in order to be considered as belonging to the same drought event. Consequently, in case of a “patchy” rainfall pattern, we can end up with simultaneous smaller drought events very close one to the other, but considered as separate events due to their discontinuity in space or time. The advantage of not having fixed boundaries or a fixed time window to define the droughts in our method becomes a drawback in this case. This limitation in the methodology had already been highlighted by Haslinger and Blöschl (2017), who pointed out that the risk of applying the method to high-resolution data was that small-scale features may interrupt a coherent space-time region. Merging multiple droughts occurring simultaneously and in close proximity could be a way to overcome this issue and avoid missing some severe events due to this feature. Our study has also identified six additional droughts not well known until now: an early drought rich period in the 1860s and 1870s particularly in the NW, a severe drought in the “Transition” region in 1937–38, and a severe drought in the NW in 1955–56. Five out of these six “new” droughts were also identified in the recent study by Murphy et al. (2020) as “severe” droughts (12-month SPI > −1.5), with the exception of the 1870–1873 one which fell into the category of “moderate” drought. Murphy et al. (2020) use single long national-scale rainfall time series for England, Scotland and Ireland (albeit each being a combination of multiple gauges) so the current study adds value by characterising the spatiotemporal signature of these events.
The study of drought frequency trend analysis (Section “Results - Trend Analysis,” Figure 7) and the timeline of historic droughts (Section “Historic Timeline of Droughts,” Figure 10 and Supplementary Figure 1) highlighted the existence of an apparent alternation between severe droughts in the NW and the SE for long accumulation periods (12 and 24 months), with clusters of droughts in the SE occurring 1920–1940 and 1975–2000 and droughts in the NW occurring 1860–1900 and 1940–1975. This pattern coincides with decadal fluctuations in the winter North Atlantic Oscillation (NAO) index (Hurrell, 1995; Visbeck et al., 2001), proven to be correlated to precipitation levels in the NW (Wilby et al., 1997; West et al., 2019). Negative winter NAO indices are known to be linked to lower precipitation in the NW, which is consistent with the cluster of severe droughts observed in that region in 1860–1900 and 1940–1975, both periods experiencing persistent negative winter NAO index. The smoothing involved in the long accumulation periods suggest that the NW-SE drought alternation is related to this well-established low frequency variability in the climate system associated with the NAO, and ultimately its larger-scale drivers. Previous studies (e.g., Folland et al., 2015; Svensson and Hannaford, 2019) have described the NW-SE rainfall gradient in the United Kingdom and the various Atlantic to global scale ocean-atmosphere drivers of these patterns.
Regional Differences in Drought Characteristics
Our findings confirm that the NW is generally affected by shorter duration, less severe, albeit more frequent droughts. This might be explained by generally more variability in precipitation in the NW compared to the SE. However, for long accumulation periods, droughts were found to also be extended and severe in the NW. This might be because over that timescale, we are dealing with moderately dry years that might consist of a run of several droughts with wetter interludes, rather than a true extended drought. The NW is characterised by plenty of rainfall in absolute terms and hydrologically is dominated by rapidly responding catchments with little storage capacity. Consequently, even during long-term rainfall deficits, impacts on water resources may not be so dramatic if there are short periods of wetter weather which can “reset” the drought conditions and allow the water resources to recover in between the drier spells. It is also possible that, to a certain extent, the lower density of raingauges pre-1961 is contributing to overestimation of the spatial extent, and hence the severity, of droughts in the NW (see Section “Uncertainties in the Data”).
Short intense droughts are potentially more damaging for the NW as no stored water is available to compensate for this short-term deficit. Our study shows that severe droughts at short accumulation period are less frequent in the NW than in the SE, however, short-term deficits can have severe impacts on water resource availability in the NW due to the limited water stored within catchments.
This study has highlighted that the NW suffers overall more frequent short and less severe droughts. Although these events are unlikely to cause major impacts, because the catchments are so responsive, they could still locally and temporarily threaten water supply – moreover, even short, summer “flash” droughts in responsive parts of western England can rapidly cause other social and environmental impacts (e.g., on aquatic ecosystems, due to low river flows, and terrestrial systems (e.g., dry soils leading to wildfires and agricultural impacts)). The heatwave driven drought of 2018 was one such example (Parry et al., 2018).
In the SE however, slow-responding, groundwater-dominated catchments and water resources prevail. This trait makes the SE generally resilient to short-term droughts, even if intense, in terms of water resources availability. They can still be problematic for ecosystems and many sectors (e.g., non-irrigated agriculture) if the soil moisture is depleted, but it is prolonged rainfall deficits that are likely to result in impacts on water availability. Typically, multiannual droughts with multiple dry winters (winter being the water recharge period) have the greatest impact in this groundwater-dominated region (Marsh et al., 2007; Folland et al., 2015). Population density, and hence water demand, is higher in the SE, and is expected to increase over the coming decades. Many areas of the SE are already water stressed and this is expected to deteriorate further with the combined effect of increasing water demand (Environment Agency, 2020) and changes in water availability as a result of climate change, which will alter the distribution of evapotranspiration and precipitation (Prudhomme et al., 2012). Water managers are facing unprecedented challenges, and the understanding of drought dynamics provided by our study will be a useful foundation for informing effective planning for future drought mitigation.
Spatial Coherence of Droughts
Regarding spatial coherence of droughts, it is interesting to see that, when all drought events are considered, for a significant proportion of months in drought (between 15 and 20% depending on the accumulation period considered), the SE and NW are simultaneously in drought (Figure 12). However, when only the most severe droughts are considered (top 20 droughts in each region, Figure 13), seldom are the SE and NW simultaneously in drought (less than 4%). This corroborates the findings by Folland et al. (2015) that for fifteen major long droughts in the United Kingdom there was a significant anti-correlation in the average precipitation anomaly between the NW and the SE, in particular for winter months (i.e., droughts in one region are unlikely to affect the other). Our study shows that this relationship is not observed for less severe drought events, for which droughts tend to be more spatially coherent. This, in turn, confirms the observations by Rahiz and New (2012) that drought events with moderate severity and short duration have greater spatial coherence. However, they also found that events taking place during the hydrological wet season (October to March) had greater spatial coherence than during the dry season (April to September), which was not clear in our results (Supplementary Figures 3–6). Here we observe a higher spatial coherence in spring and summer for long accumulation periods only (Supplementary Figure 6). It should be noted though that unlike Rahiz and New (2012), we have considered four seasons (Spring = MMA, Summer = JJA, Autumn = SON, Winter = DJF), which might partly explain the differences in results.
Spatial coherence, or lack thereof, has important implications for drought management, especially as the tendency is now to consider inter-region drought planning in a more integrated way (e.g., Environment Agency, 2020). The fact that historically, when the SE has suffered an extremely severe drought, the NW was (almost) never in drought, and vice-versa, has important implications for example for the prospect of inter-regional water transfer – a method in which water is supplied to a region in drought from areas not experiencing drought. In reality, for practical applications the regions used for water resources planning do not map onto the statistically defined regions used herein, so these results are more indicative rather than pertaining to particular transfers. Such transfers are normally predicated on a donor area in the wetter, upland areas like Wales (transition region) transferring to a drier lowland area in the south-east – as for example in the Severn-Thames transfer. Our results demonstrate that for the top 20 most severe droughts, when the transition region is in drought, 33–40% of the time (depending on accumulation period), the SE is also in drought. Therefore in situation of extreme droughts, about 60% of the time, water transfer could be considered. Such information could provide important probabilistic information for water resource planners considering the viability of transfers over the long-term.
Moreover the set of extracted drought events could be used for similar coherence analyses using different, operationally aligned regions in future. Importantly, however, here we only consider the possibility of coherent historical meteorological droughts but water resources planning requires future climate change to be considered and hydrological modelling and water supply system simulations to be undertaken (as in e.g., Dobson et al. (2020)). Some studies suggest the likelihood of coherent droughts across regions is likely to increase in future under anthropogenic warming (Rudd et al., 2019) whereas others do not show such large changes in coherence (Dobson et al., 2020). However, such studies have mostly used fixed regions and quite simple definitions of the likelihood of regions jointly being “in drought.” The spatiotemporal extraction approach suggested here could be used in future studies to extract droughts from climate projections before running them through hydrological and supply system models.
Conclusion
In this paper, we employ a novel approach used for the first time in GB for identifying meteorological drought events based on connected space-time areas for a historic period from 1862 to 2015. We characterise these events based on their spatial extent, duration, average intensity and severity, and compare events occurring in three main regions of GB: the SE, the NW and a “Transition” region in-between them. For long accumulation periods (12 and 24 months), the timeline of historic drought events showed an alternation of drought rich multi-decadal periods between the SE and the NW, which coincides with the fluctuations in the NAO index. Our results also show that less severe and short droughts are more frequent in the NW than in the SE for short and medium accumulation periods (3, 6, and 12 months), whereas more severe and long droughts with larger spatial extent are more frequent in the SE. However, for long accumulation periods (24 months), fewer differences are observed between the NW and the SE. Our results provide insight on the frequency of drought characteristics such as extent, duration and severity for different regions in GB. By highlighting and quantifying these differences, our study informs water managers to help them tailor their drought management strategies to the specific characteristics of droughts in a given region. Most known major droughts rank highly in the results, and a few additional droughts are identified. This method allows a full spatiotemporal characterisation of these droughts in a way not previously done for GB.
Regarding the spatial coherence of droughts, the results showed that most of the time, the “Transition” and the SE regions are simultaneously in drought. Furthermore, when the SE is in drought, about a third of the time the NW is also in drought (and vice-versa), when all droughts in the historical record are considered. However, if we only select the 20 most severe droughts, then very few events occur simultaneously in the SE and NW. This opens up the possibility of regional water-transfer as a potential water management solution to face extreme drought situations. Overall, the present study has great potential to inform water management strategies for future drought planning exercises in Great Britain.
Data Availability Statement
The raw data supporting the conclusions of this article will be made available by the authors, without undue reservation.
Author Contributions
All authors contributed to the conception and planning of the analysis. KH ran the analysis to extract the drought events from the gridded rainfall time series. CS performed the clustering analysis to define the study regions. MT did the frequency analysis, timeline of droughts events, and spatial coherence analysis. All authors contributed to the interpretation of the results. MT took the lead in writing the manuscript. All authors provided critical feedback and helped shape the research, analysis, and manuscript.
Funding
This research is an outcome of the UK Drought & Water Scarcity Programme Historic Droughts project, financial support was provided by the UK Natural Environment Research Council [NE/L01061X/1].
Conflict of Interest
The authors declare that the research was conducted in the absence of any commercial or financial relationships that could be construed as a potential conflict of interest.
Acknowledgments
The authors would like to thank the Met Office for providing the Historic Droughts gridded rainfall dataset used in this study, in particular Mark McCarthy and Tim Legg.
Supplementary Material
The Supplementary Material for this article can be found online at: https://www.frontiersin.org/articles/10.3389/fenvs.2021.639649/full#supplementary-material
Footnotes
- ^ https://historicdroughts.ceh.ac.uk/
- ^ https://historicdroughts.ceh.ac.uk/content/drought-inventory
References
Andreadis, K. M., Clark, E. A., Wood, A. W., Hamlet, A. F., and Lettenmaier, D. P. (2005). Twentieth-century drought in the conterminous united states. J. Hydrometeorol. 6, 985–1001. doi: 10.1175/JHM450.1
Arnell, N. W., Lowe, J. A., Bernie, D., Nicholls, R. J., Brown, S., Challinor, A. J., et al. (2019). The global and regional impacts of climate change under representative concentration pathway forcings and shared socioeconomic pathway socioeconomic scenarios. Environ. Res. Lett. 14:e084046. doi: 10.1088/1748-9326/ab35a6
Bachmair, S., Stahl, K., Collins, K., Hannaford, J., Acreman, M., Svoboda, M., et al. (2016). Drought indicators revisited: the need for a wider consideration of environment and society. WIREs Water 3, 516–536. doi: 10.1002/wat2.1154
Barker, L. J., Hannaford, J., Chiverton, A., and Svensson, C. (2016). From meteorological to hydrological drought using standardised indicators. Hydrol. Earth Syst. Sci. 20, 2483–2505. doi: 10.5194/hess-20-2483-2016
Barker, L. J., Hannaford, J., Parry, S., Smith, K. A., Tanguy, M., and Prudhomme, C. (2019). Historic hydrological droughts 1891–2015: systematic characterisation for a diverse set of catchments across the UK. Hydrol. Earth Syst. Sci. 23, 4583–4602. doi: 10.5194/hess-23-4583-2019
Blauhut, V. (2020). The triple complexity of drought risk analysis and its visualisation via mapping: a review across scales and sectors. Earth Sci. Rev. 210:103345.
Burke, E. J., and Brown, S. J. (2010). Regional drought over the UK and changes in the future. J. Hydrol. 394, 471–485. doi: 10.1016/j.jhydrol.2010.10.003
Burke, E. J., Perry, R. H. J., and Brown, S. J. (2010). An extreme value analysis of UK drought and projections of change in the future. J. Hydrol. 388, 131–143. doi: 10.1016/j.jhydrol.2010.04.035
Dobson, B., Coxon, G., Freer, J., Gavin, H., Mortazavi-Naeini, M., and Hall, J. W. (2020). the spatial dynamics of droughts and water scarcity in England and Wales. Water Resourc. Res. 56:e2020WR027187. doi: 10.1029/2020WR027187
Environment Agency (2020). Meeting our Future Water Needs: a National Framework for Water Resources. Environment Agency 2020. Available online at: https://assets.publishing.service.gov.uk/government/uploads/system/uploads/attachment_data/file/873100/National_Framework_for_water_resources_summary.pdf (accessed October 10, 2020).
Folland, C. K., Hannaford, J., Bloomfield, J. P., Kendon, M., Svensson, C., Marchant, B. P., et al. (2015). Multi-annual droughts in the English Lowlands: a review of their characteristics and climate drivers in the winter half-year. Hydrol. Earth Syst. Sci. 19, 2353–2375. doi: 10.5194/hess-19-2353-2015
Gordon, A. D. (1981). Classification: CRC Monographs on Statistics & Applied Probability. London: Chapman and Hall.
Hannaford, J., Lloyd-Hughes, B., Keef, C., Parry, S., and Prudhomme, C. (2011). Examining the large-scale spatial coherence of European drought using regional indicators of precipitation and streamflow deficit. Hydrol. Process. 25, 1146–1162. doi: 10.1002/hyp.7725
Haslinger, K., and Blöschl, G. (2017). Space-time patterns of meteorological drought events in the European greater alpine region over the past 210 years. Water Resourc. Res. 53, 9807–9823. doi: 10.1002/2017WR020797
Hurrell, J. W. (1995). Decadal trends in the north atlantic oscillation: regional temperatures and precipitation. Science 269:676. doi: 10.1126/science.269.5224.676
Jones, P. D., and Lister, D. H. (1998). Riverflow reconstructions for 15 catchments over England and Wales and an assessment of hydrologic drought since 1865. Intern. J. Climatol. 18, 999–1013.
Keller, V. D. J., Tanguy, M., Prosdocimi, I., Terry, J. A., Hitt, O., Cole, S. J., et al. (2015). CEH-GEAR: 1 km resolution daily and monthly areal rainfall estimates for the UK for hydrological and other applications. Earth Syst. Sci. Data 7, 143–155. doi: 10.5194/essd-7-143-2015
Legg, T. (2015). Uncertainties in gridded area-average monthly temperature, precipitation and sunshine for the United Kingdom. Intern. J. Climatol. 35, 1367–1378. doi: 10.1002/joc.4062
Livada, I., and Assimakopoulos, V. D. (2007). Spatial and temporal analysis of drought in greece using the Standardized Precipitation Index (SPI). Theore. Appl. Climatol. 89, 143–153. doi: 10.1007/s00704-005-0227-z
Lloyd-Hughes, B. (2012). A spatio-temporal structure-based approach to drought characterisation. Intern. J. Climatol. 32, 406–418. doi: 10.1002/joc.2280
Marsh, T., Cole, G., and Wilby, R. (2007). Major droughts in England and Wales, 1800–2006. Weather 62, 87–93. doi: 10.1002/wea.67
Mayes, J., and Wheeler, D. (2013). Regional weather and climates of the British Isles - Part 1: introduction. Weather 68, 3–8. doi: 10.1002/wea.2041
McKee, T. B., Doesken, N. J., and Kleist, J. (1993). “The relationship of drought frequency and duration to time scales,” in Proceedings of the Eighth Conference on Applied Climatology, 17-22 January 1993, Anaheim, CA.
MetOffice (2019). MIDAS Open: UK Daily Rainfall Data, v201901. Chilton: Centre for Environmental Data Analysis.
MetOffice (2020). MIDAS Open: UK Daily Rainfall Data, v201901. Chilton: Centre for Environmental Data Analysis.
MetOffice, Hollis, D., and McCarthy, M. (2017). UKCP09. Met Office Gridded and Regional Land Surface Climate Observation Datasets. Centre for Environmental Data Analysis. Available online at: http://catalogue.ceda.ac.uk/uuid/87f43af9d02e42f483351d79b3d6162a (accessed November 15, 2020).
Murphy, C., Wilby, R. L., Matthews, T., Horvath, C., Crampsie, A., Ludlow, F., et al. (2020). The forgotten drought of 1765–1768: reconstructing and re-evaluating historical droughts in the British and Irish Isles. Intern. J. Climatol. 40, 5329–5351. doi: 10.1002/joc.6521
Parry, S., Wilby, R., Prudhomme, C., Wood, P., and McKenzie, A. (2018). Demonstrating the utility of a drought termination framework: prospects for groundwater level recovery in England and Wales in 2018 or beyond. Environ. Res. Lett. 13:064040. doi: 10.1088/1748-9326/aac78c
Parry, S., Wilby, R. L., Prudhomme, C., and Wood, P. J. (2016). A systematic assessment of drought termination in the United Kingdom. Hydrol. Earth Syst. Sci. 20, 4265–4281. doi: 10.5194/hess-20-4265-2016
Perry, M., and Hollis, D. (2005). The generation of monthly gridded datasets for a range of climatic variables over the UK. Intern. J. Climatol. 25, 1041–1054. doi: 10.1002/joc.1161
Prudhomme, C., Dadson, S., Morris, D., Williamson, J., Goodsell, G., Crooks, S., et al. (2012). Future flows climate: an ensemble of 1-km climate change projections for hydrological application in Great Britain. Earth Syst. Sci. Data 4, 143–148. doi: 10.5194/essd-4-143-2012
Prudhomme, C., Giuntoli, I., Robinson, E. L., Clark, D. B., Arnell, N. W., Dankers, R., et al. (2014). Hydrological droughts in the 21st century, hotspots and uncertainties from a global multimodel ensemble experiment. Proc. Natl. Acad. Sci. U.S.A. 111:3262. doi: 10.1073/pnas.1222473110
Rahiz, M., and New, M. (2012). Spatial coherence of meteorological droughts in the UK since 1914. Area 44, 400–410.
Raut, B. A., Reeder, M. J., and Jakob, C. (2017). Trends in CMIP5 Rainfall Patterns over Southwestern Australia. J. Clim. 30, 1779–1788. doi: 10.1175/JCLI-D-16-0584.1
Ribeiro, A. F. S., Russo, A., Gouveia, C. M., and Pires, C. A. L. (2020). Drought-related hot summers: a joint probability analysis in the Iberian Peninsula. Weather Clim. Extrem. 30:100279. doi: 10.1016/j.wace.2020.100279
Rodda, J. C., and Dixon, H. (2012). Rainfall measurement revisited. Weather 67, 131–136. doi: 10.1002/wea.875
Rudd, A. C., Kay, A. L., and Bell, V. A. (2019). National-scale analysis of future river flow and soil moisture droughts: potential changes in drought characteristics. Clim. Chang. 156, 323–340. doi: 10.1007/s10584-019-02528-0
Santos, J. F., Portela, M. M., and Pulido-Calvo, I. (2011). Regional frequency analysis of droughts in portugal. Water Resourc. Manag. 25:3537. doi: 10.1007/s11269-011-9869-z
Sheffield, J., Andreadis, K. M., Wood, E. F., and Lettenmaier, D. P. (2009). Global and continental drought in the second half of the Twentieth century: severity–area–duration analysis and temporal variability of large-scale events. J. Clim. 22, 1962–1981. doi: 10.1175/2008JCLI2722.1
Spinoni, J., Lakatos, M., Szentimrey, T., Bihari, Z., Szalai, S., Vogt, J., et al. (2015). Heat and cold waves trends in the Carpathian Region from 1961 to 2010. Intern. J. Climatol. 35, 4197–4209. doi: 10.1002/joc.4279
Stedinger, J. R., Vogel, R. M., and Foufoula-Georgiou, E. (1993). “Frequency analysis of extreme events,” in Handbook of Hydrology, ed. D. R. Maidment (New York, NY: McGraw-Hill).
Svensson, C., and Hannaford, J. (2019). Oceanic conditions associated with Euro-Atlantic high pressure and UK drought. Environ. Res. Commun. 1:101001. doi: 10.1088/2515-7620/ab42f7
Tanguy, M., Dixon, H., Prosdocimi, I., Morris, D. G., and Keller, V. D. J. (2019). Gridded Estimates of Daily and Monthly Areal Rainfall for the United Kingdom (1890-2017) [CEH-GEAR]. Atlanta, GE: NERC Environmental Information Data Centre.
van der Schrier, G., Efthymiadis, D., Briffa, K. R., and Jones, P. D. (2007). European Alpine moisture variability for 1800–2003. Intern. J. Climatol. 27, 415–427. doi: 10.1002/joc.1411
Vicente-Serrano, S. M. (2006). Spatial and temporal analysis of droughts in the Iberian Peninsula (1910–2000). Hydrol. Sci. J. 51, 83–97. doi: 10.1623/hysj.51.1.83
Vicente-Serrano, S. M. (2007). Evaluating the impact of drought using remote sensing in a mediterranean, Semi-arid Region. Nat. Hazards 40, 173–208. doi: 10.1007/s11069-006-0009-7
Visbeck, M. H., Hurrell, J. W., Polvani, L., and Cullen, H. M. (2001). The North Atlantic oscillation: past, present, and future. Proc. Natl. Acad. Sci. 98:12876. doi: 10.1073/pnas.231391598
WaterAct (2014). Water Act 2014, Chapter 21, eds Office, T. S., London. Available online at: https://www.legislation.gov.uk/ukpga/2014/21/pdfs/ukpga_20140021_en.pdf (accessed October 10, 2020).
WaterUK (2016). Water Resources Long Term Planning Framework (2015-2065), Technical Report, Water Resources Long Term Planning Framework Water UK. Available online at: https://www.water.org.uk/wp-content/uploads/2018/11/WaterUK-WRLTPF_Final-Report_FINAL-PUBLISHED-min.pdf (accessed October 10, 2020).
West, H., Quinn, N., and Horswell, M. (2019). Regional rainfall response to the North Atlantic Oscillation (NAO) across Great Britain. Hydrol. Res. 50, 1549–1563. doi: 10.2166/nh.2019.015
Wilby, R. L., O’Hare, G., and Barnsley, N. (1997). The North Atlantic Oscillation and British Isles climate variability, 1865–1996. Weather 52, 266–276. doi: 10.1002/j.1477-8696.1997.tb06323.x
Keywords: spatiotemporal droughts, frequency analysis, return period, spatial coherence, drought area, drought duration, drought severity
Citation: Tanguy M, Haslinger K, Svensson C, Parry S, Barker LJ, Hannaford J and Prudhomme C (2021) Regional Differences in Spatiotemporal Drought Characteristics in Great Britain. Front. Environ. Sci. 9:639649. doi: 10.3389/fenvs.2021.639649
Received: 09 December 2020; Accepted: 22 February 2021;
Published: 12 March 2021.
Edited by:
Vimal Mishra, Indian Institute of Technology Gandhinagar, IndiaReviewed by:
Jonghun Kam, Pohang University of Science and Technology, South KoreaXander Wang, University of Prince Edward Island, Canada
Copyright © 2021 Tanguy, Haslinger, Svensson, Parry, Barker, Hannaford and Prudhomme. This is an open-access article distributed under the terms of the Creative Commons Attribution License (CC BY). The use, distribution or reproduction in other forums is permitted, provided the original author(s) and the copyright owner(s) are credited and that the original publication in this journal is cited, in accordance with accepted academic practice. No use, distribution or reproduction is permitted which does not comply with these terms.
*Correspondence: Maliko Tanguy, malngu@ceh.ac.uk