Dynamic High Resolution Hydrological Status Monitoring in Real-Time: The UK Water Resources Portal
 Lucy J. Barker
 Matt Fry1
  Jamie Hannaford
 Maliko Tanguy
- 1UK Centre for Ecology & Hydrology, Wallingford, United Kingdom
- 2Irish Climate Analysis and Research UnitS (ICARUS), Maynooth University, Maynooth, Ireland
- 3UK Centre for Ecology & Hydrology, Edinburgh, United Kingdom
Understanding the current hydro-meteorological situation is critical to manage extreme events and water resources. The United Kingdom Water Resources Portal (UKWRP) has been developed to enable dynamic, interactive access to hydro-meteorological data across the United Kingdom, including catchment daily rainfall (near), real-time daily mean river flows, groundwater levels, real-time soil moisture data, and standardised climate indices. The UKWRP offers a way of exploring the full range of river flow and rainfall variability, including comparing current conditions to those in the past, from droughts to floods. A variety of different plotting capabilities mean users can view and explore data in different ways depending on their requirements. Here we discuss the mechanisms and the engagement undertaken to develop the UKWRP, in addition to the technical issues and solutions of bringing multiple data sources and types together, how the data are processed, stored and published to deliver an integrated tool for water resources management. The UKWRP enables all water users–from farmers, to water companies to members of the general public–to view and explore the data used by regulators to manage water supplies. We demonstrate how the UKWRP can be used to monitor the hydrological situation, using recent examples of both floods and droughts, and enables consistent messaging and universal access to data and information. Finally, we discuss the decisions the information provided in the UKWRP can support, and possible future developments. The UKWRP is aimed at the United Kingdom water research and management community, but we envisage that the Portal (and the development pathway and technical solutions reported here) could provide a useful exemplar for similar systems in other international settings.
1 Introduction
Hydrological data are the foundation of effective water resources management and underpin decision-making across a wide range of sectors. The acute water management problems of the 21st Century, from national through to global scales, can only be tackled through improved access to hydrological data, of appropriate quality and with the requisite timeliness needed to support decision-making on the ground (e.g. Dixon et al., 2020). Increasingly, there is a need for hydrological datasets (including rainfall, river flows, groundwater levels and soil moisture) to be available ever closer to real-time, and at very high spatial resolutions to support local-scale decision making. At the same time, new monitoring technologies and informatics tools are enabling rapid advances in the delivery of hydrological data when and where it is needed (Tauro et al., 2018). There is therefore a need for systems that capitalise on this potential, operating at the interface between hydrometric monitoring systems, and data users and decision-makers. Such systems should provide a seamless pipeline from raw data captured by sensing technologies through to actionable information provided with the latency needed by users. Crucially, the development of such systems should be an iterative process of co-design and co-development engaging both data providers and data users to ensure they are fit for purpose and support management systems (Hannaford et al., 2019; Grainger et al., 2021).
To this end, monitoring and early warning (MEW) systems are a particularly important pillar of effective water resources and hazard management (e.g. Wilhite, 2014). A recent World Meteorological Organization (WMO) report on the state of climate services internationally (World Meteorological Organization, 2020) notes that “As climate change continues to threaten human lives, ecosystems and economies, risk information and early warning systems are increasingly seen as key for reducing these impacts”. The report goes on to say that in many parts of the world, such systems are deficient and require significant investment to make them fit-for-purpose. MEW systems enable timely provision of hydrological datasets to users, who need hydrological status to be characterised and put into historical context (e.g. by comparing the severity of the current flood or drought compared to past events). Quantifying and characterising current water resources status is a necessary prerequisite for applying appropriate and timely mitigation measures (e.g. those identified in drought or flood risk management plans) to avoid impacts. MEW systems are thus a vital part of our response to hydrological hazards–they are essential for proactive flood and drought management and a key part of disaster preparedness. This has led to a proliferation of MEW systems relevant for hydrological hazards, at a range of scales from river catchment through national to continental and even global (see for example the reviews of Pulwarty and Sivakumar, 2014 and Hao et al., 2017).
However, MEW is not just relevant for extreme hydrological events–water managers need to track water resources status across the entire hydrological spectrum from floods to droughts and all points in between, on a range of timescales from sub-daily through to annual and beyond. Knowledge of current water resources status is vital for a wide range of purposes including, for example: water allocation and abstraction licensing; appraising potential impacts on aquatic ecology; water quality assessment and so on. Many of these aspects are crucial to the day-to-day operations of ‘statutory’ stakeholders like water service providers, government agencies and regulators, etc. However, such information is also of fundamental importance to a very wide range of water users, including, but not limited to: farmers and growers; water dependent industrial or commercial businesses; power generation agencies; navigation; recreational users (e.g. canoeing, angling); conservation groups; catchment management partnerships; and more widely, citizens and communities with concerns about their local environment/watercourse.
The United Kingdom (UK) has a very well established hydrological monitoring programme and is very densely monitored by international standards. The UK also has very well established MEW systems and other tools for tracking water resources status. The National Hydrological Monitoring Programme (NHMP)1, operated by the UK Centre for Ecology & Hydrology (UKCEH) and the British Geological Survey (BGS), has provided an accessible, independent monthly “Hydrological Summary for the UK” since 1988 that reports on rainfall, river flows, groundwater and reservoir stocks, as well as notable temperatures and soil moisture deficits. Similarly, the UK regulatory agencies provide similar “Water Situation Reports” that are comparable in scope and appearance to the Hydrological Summary for the UK. UKCEH, BGS, the UK Met Office and these agencies also produce the “Hydrological Outlook UK” (Prudhomme et al., 2017), a monthly hydrological seasonal forecasting service, operational since 2013. There are also very sophisticated systems for flood warning run by the Great Britain regulators (i.e., Environment Agency in England, Scottish Environment Protection Agency and Natural Resources Wales)2.
With the exception of the latter real-time, web-based flood warning services, a common thread of all these MEW products is that they are static pre-formatted reports prepared on a monthly basis. Until recently, there were no national UK-scale real-time, dynamic tools available for water resources status assessment. There has long been a need for improved MEW systems (Hannaford et al., 2019), especially in the context of climate change and an evolving policy landscape (Robins et al., 2017). This paper describes the development of a novel, high-resolution interactive system for hydrological status monitoring for the UK, the UK Water Resources Portal (UKWRP)3, which aims to address these gaps in UK MEW.
The UKWRP was launched in spring 2020 following a long period of iterative co-design and co-development with a range of stakeholders. This paper sets out to:
i) Describe the process of development, particularly the stakeholder engagement process,
ii) Present the Portal itself, including the datasets it includes, the informatics systems on which it is based, and the visualisations it offers,
iii) Provide examples of the potential applications of the Portal, and
iv) Describe potential future development of the Portal, much of which is already underway.
We present the UKWRP as an operational system delivering a step-change in hydrological status assessment and data integration more generally for the UK, and as an exemplar case study that we hope can provide important lessons for other hydrological data management and early warning systems in other contexts. While the UK is a particular case study, and a data rich environment at that, many of the challenges will resonate with other countries and settings, and the underlying principles (in terms of the design and stakeholder engagement process as well as particular data/informatics solutions) could be transferable elsewhere.
2 Co-Design and Co-Development of the UKWRP
The UKWRP is the culmination of an iterative development programme that extends back to several workshops held in 2015 and 2016 as part of the DrIVER (Drought Impacts: Vulnerability thresholds in monitoring and Early-warning Research) project4. This stakeholder engagement exercise, summarised in detail in Hannaford et al. (2019), was focused on understanding the specific drought MEW needs in the UK, and scoping out potential enhanced MEW systems for the future. Although the broad spectrum of responses reflected the diversity of sectors represented (including government, regulators, water supply companies, agriculture, the environment and public health), there were some similarities. Users wanted a drought MEW system that:
• Provided information about different types of drought, from meteorological, to hydrological, to agricultural,
• Showed information at a range of spatial scales, from the local, field scale, to the regional and national scale,
• Showed information for a range of time scales, from droughts at the 1 month scale, to the annual or multi-year scale,
• Compared current conditions with those from historic drought events, and
• Was open and accessible for all, enabling consistent messaging between government departments, regulators, water companies and other organisations.
Crucially, around the time of the first workshop we developed a prototype drought-focused MEW system, the UK Drought Portal5 (UKDP, shown in Figure 1A), a demonstrator developed as a showcase of “what’s possible” for drought MEW in the UK. Although the UKDP at the time was not strictly a MEW system as it was not updated monthly (this was added in 2017, as discussed below), it demonstrated the potential of a web-based system to allow interactive mapping and time series visualisation of the current drought situation compared to historical conditions.
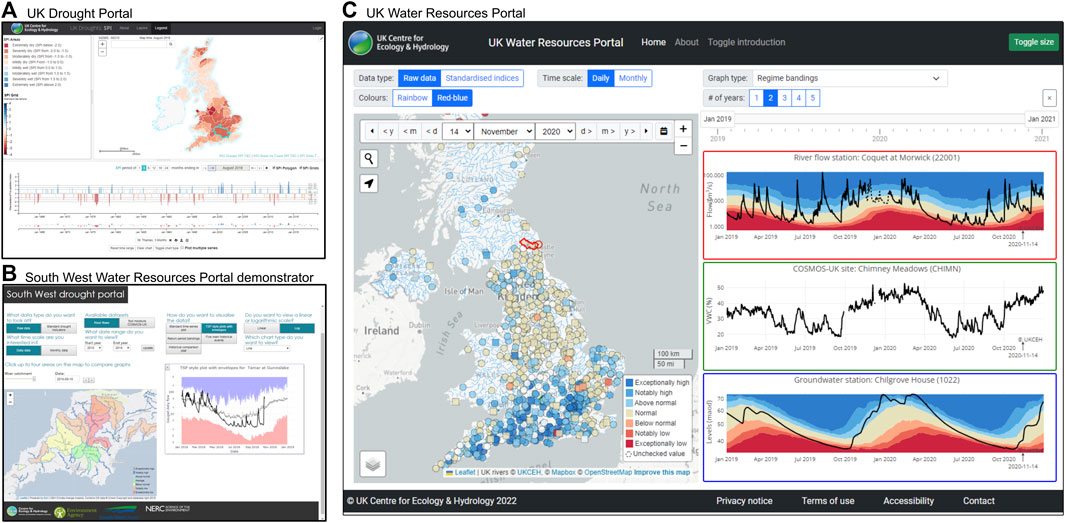
FIGURE 1. Evolution of the UK Water Resources Portal: (A) screen shot of the UK Drought Portal showing the SPI-3 for the UK, (B) screen short of the South West Water Resources Demonstrator Portal showing river flow data from the south west of England; (C) screen shot of the UK Water Resources Portal showing map and time series data for the 14 November 2020 for river flows, soil moisture and groundwater levels at sites across England showing the default graph types in the red-blue colour scheme.
There are many drought indicators and indices that have been developed and applied in the academic literature (Lloyd-Hughes, 2014), but the UKDP adopted the Standardised Precipitation Index (SPI; McKee et al., 1993). The SPI was selected because: 1) it can be compared across both space and time; 2) it can be calculated for different, user-defined accumulation periods (McKee et al., 1993); and 3) comparable standardised indices for other variables such as river flows and groundwater are available (e.g. Standardised Streamflow Index (SSI), Vicente-Serrano et al., 2012; Standardised Groundwater Index (SGI), Bloomfield and Marchant, 2013). These three characteristics directly address some of the requirements stated by stakeholders listed above and discussed in Hannaford et al. (2019). The SPI is also recommended by the WMO for meteorological drought monitoring (Hayes et al., 2011).
Prior to its use in the UKDP, the SPI and other standardised indices had not been widely used in the UK, particularly in operational settings for water and drought management (Barker et al., 2016). As such, in parallel with the stakeholder engagement process and the development of the UKDP, a number of scientific studies were undertaken using the SPI and related standardised indices. Firstly, investigating the most appropriate probability distributions to fit to UK rainfall and river flow data when calculating the SPI and SSI, respectively (Svensson et al., 2017); and secondly, assessing what the SPI and SSI showed in terms of drought characteristics and drought propagation from meteorological to hydrological drought in near-natural UK catchments (Barker et al., 2016).
The UKDP provided interactive access to SPI data at the gridded scale (5 km; Tanguy et al., 2015) as well as river basins (specifically, “Integrated Hydrological Units”, IHUs; National River Flow Archive, 2014; Tanguy et al., 2017b, Tanguy et al., 2017c)—meeting stakeholder criteria for data and information at the local and national scale. Users were able to view maps and time series graphs of SPI for individual grid cells or river basins enabling a comparison with historic events; as well as downloading timeseries of SPI for their selected location (catchment or grid cell). The UKDP was made operational as a true MEW system, with monthly updates of SPI from June 2017. Although the UKDP provided open access to the SPI at a range of spatial and temporal scales, it only offered SPI data, meaning users were only able to directly monitor meteorological droughts. At the second DrIVER workshop (held in November 2016) mock-ups were made of the UKDP to include river flows and groundwater levels shown as SSI and SGI data (see Hannaford et al., 2019). Positive feedback was received from a wide range of stakeholders, which emphasised the benefit of advancing the UKDP concept and expanding it to include other variables and indices.
In late 2017, a further phase of development commenced, funded through the ENDOWS (Engaging diverse stakeholders and publics with outputs from the UK Drought and Water Scarcity Programme) project6, which aimed to expand the UKDP by including monthly updates of river flows and groundwater levels. At the time however, a major limitation was the difficulty of obtaining timely up-to-date river flow and groundwater level data at the national scale. The UK regulators (the Environment Agency (EA; England), the Scottish Environment Protection Agency (SEPA), Natural Resources Wales (NRW) and the Department for Infrastructure Rivers (DfIR; Northern Ireland) operate independent archives, and even within each organisation with a centralised hydrometric archive there were significant challenges in data provision. Consequently, static MEW efforts (e.g., the NHMP monthly Hydrological Summary for the UK) relied on a number of manual data transfers. Fortunately, in late 2017 the EA commenced a programme of releasing its daily river flow data through the Hydrology Data API7 in near real-time, as part of a wider Open Data initiative. This offered up the prospect of building the next generation of the UKDP in a way that could exploit such live data feeds.
The EA Hydrology Data API was released in stages, with an initial pilot in Devon and Cornwall in southwest England released in 2018. To accommodate this, we developed a demonstrator portal for this region, as a collaboration with the EA and a private water company, South West Water - the South West Water Resources Demonstrator Portal (shown in Figure 1B). As well as building on the concepts of the UKDP to incorporate additional variables to rainfall indices, this demonstrator explored how we could access and visualise the new live river flow data from the API. Crucially, the South West Water Resources Demonstrator Portal was co-developed with stakeholders, facilitated through a series of meetings and exchanges. This allowed us to accommodate the stakeholder feedback on functionality and suggestions of potential new approaches to visualisation–for example, ensuring we presented graphs in manner that resonated with water industry and regulatory users (the “regime bandings”, and historical analogue comparisons, see Section 4).
The South West Portal Water Resources Demonstrator Portal was developed throughout 2019. While it was focused on one region, it provided an example proof-of-concept that enabled engagement and testing with other users and sectors around the UK. An accelerated programme of software development and user engagement then commenced through 2018 and 2019, and the EA Hydrology Data API was rolled out to other parts of England throughout 2019. The demonstrator concept was expanded to cover the whole country, before the eventual release of the UKWRP as an operational product in March 2020 (shown in Figure 1C). Importantly, the UKWRP scope set out, right from the start, to include a range of hydrological variables, so in addition to accommodating river flows, it was designed to exploit soil moisture (made possible by the advent of real-time data from the COSMOS-UK network, described further in Section 3.4) and eventually groundwater levels from BGS.
The change of name from the UK “Drought” to “Water Resources” Portal reflected the shift away from simply characterising the drought hazard using standardised climate indices (such as the SPI). While still containing all the functionality of the original UKDP, users felt the UKWRP supported management and monitoring across the whole flow regime. An important caveat to note is that the UKWRP does not intend to provide flood status or warning information, as compared with the current national flood warning services mentioned above. It does, however, provide useful information during flood episodes, as illustrated in the case study below in Section 6.
Given the wide range of hydrological variables included, and the variety of presentation styles, early user engagement suggested that it offered the potential to be used for a wide range of water resources management purposes by a wide range of users. In addition to the early co-development in south-west England, extensive engagement and hands-on user testing was undertaken with a wide range of audiences, including (for example) workshops with the water industry (in April 2018 October 2018 and July 2019) and farmers and growers (November 2019), as well as with mixed audiences (e.g. at multi-sectoral stakeholder events in March 2018 and November 2019). Since the release of the UKWRP, bilateral discussions (e.g. with the Canal and River Trust, power companies and water companies), virtual engagements and webinars have also been undertaken (notably with conservation and catchment groups, e.g. the Rivers Trusts and Catchment Based Approach partnerships in April 2020). Some applications and feedback from this process are discussed in Section 6.
3 Data
The UKWRP displays a range of variables and drought indices following feedback from stakeholders on the need to be able to monitor different types of drought as discussed above and in Hannaford et al. (2019). It provides access to rainfall, river flow, groundwater level and soil moisture data, in their raw, observed, form, but also as standardised climate indices (with the exception of soil moisture). Data can be viewed at a range of scales, enabling national and regional overviews, as well as catchment or field scale status assessments. The data available in the UKWRP is summarised in Figure 2.
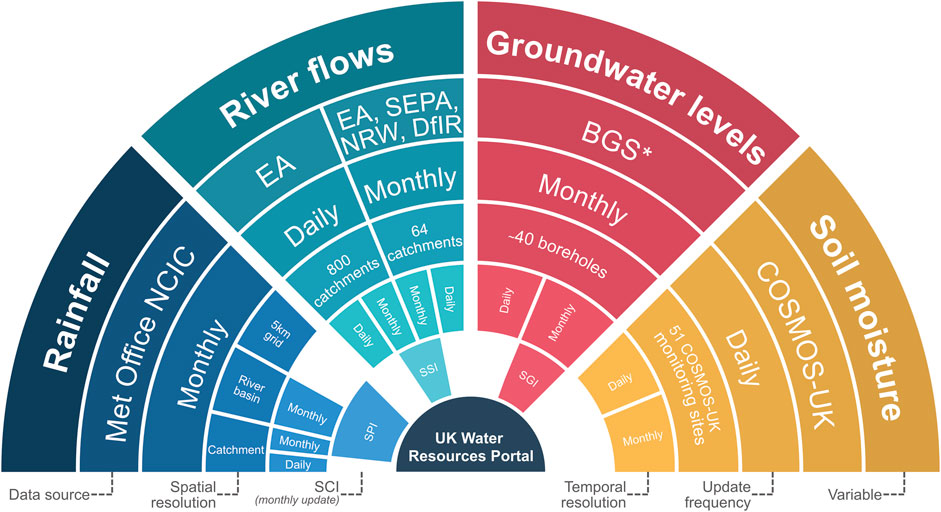
FIGURE 2. Summary of the variables and associated metadata of data available in the UK Water Resources Portal, *Note that BGS collate data in the National Groundwater Level Archive collected by the UK environmental regulators.
3.1 Rainfall
Gridded rainfall data is provided and updated once a month by the National Climate Information Centre (NCIC) at the UK Met Office, from which additional products are derived; Table 1 summarises the rainfall data available in the UKWRP. Portal users can view cumulative daily and monthly rainfall for gauged catchments, and monthly rainfall for generalised river basins (as represented by Integrated Hydrological Units (IHUs); National River Flow Archive, 2014). SPI data are available at the gridded (5 km resolution), gauged catchment or river basin scale, with historic data to 2015 available to download in Tanguy et al. (2017a), Tanguy et al. (2017b), Tanguy et al. (2017c). The SPI is calculated each month as described in McKee et al. (1993) using a reference period of 1961–2010 and the gamma distribution as set out in Tanguy et al. (2017a). The SPI is derived for different accumulation periods (1, 3, 6, 12, 18 and 24 months), providing precipitation anomalies over a range timescales from the monthly, to the seasonal and annual scale.
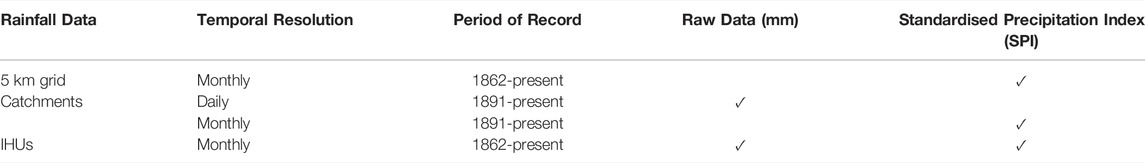
TABLE 1. Summary of rainfall data available in the UK Water Resources Portal.
3.2 River Flows
River flow data for the UKWRP is provided by the UK regulators (i.e. EA, SEPA, NRW and DfIR). Historic river flow data are taken from the National River Flow Archive (NRFA) which are validated each year by a team of NRFA regional representatives and the corresponding UK regulator (Dixon et al., 2013) which are published with a delay of one water year. In England, data for over 800 gauges are available via the EA Hydrology Data API8, which is updated in near real-time, with data available within a couple of days of being recorded. A further 64 stations across Scotland, Wales, England and Northern Ireland are available with monthly updates (within the first 2 weeks of the month) provided by the regulators as part of the NHMP Hydrological Summary for the UK. All 864 river flow records are then processed each month to calculate the SSI using a reference period of 1961–2010 (in line with that used to derive the SPI) and fitted using the Tweedie distribution, found by Svensson et al. (2017) to have the best fit for UK river flow records.
3.3 Groundwater Levels
Groundwater levels are shown for ∼40 boreholes across the UK from a range of aquifers and are updated within the first 2 weeks of the month. UK regulators provide data each month to the National Groundwater Level Archive at BGS as part of the NHMP Hydrological Summary for the UK. Where groundwater levels are automatically monitored each day, daily data are available; in some cases levels are manually measured each month and therefore data are not available for each day of the month. The SGI is provided each month by BGS and calculated using the methods set out in Bloomfield and Marchant (2013).
3.4 Soil Moisture
The UKWRP shows volumetric water content recorded at 51 COSMOS-UK (COsmic-ray Soil Moisture Observing System for the United Kingdom)9 observation sites across the UK located on a range of soil and vegetation types (Cooper et al., 2021; Stanley et al., 2021). The COSMOS-UK network provides field-scale (up to 200 m) soil moisture observations in real-time using a cosmic ray soil moisture sensor (CRS). The CRS counts the fast neutrons from cosmic rays reflected by the earth’s surface; fast neutrons are absorbed by hydrogen atoms in the soil (predominately in water molecules). A lower neutron count indicates a higher water content and by comparing current counts to background readings, can provide a measure of soil moisture (Evans et al., 2016; Cooper et al., 2021). The UKWRP shows the volumetric water content (%; VWC) which provides an absolute measure of water content in the soil, which at the extremes is determined by the soil characteristics and status is determined by the weather (Boorman et al., 2020). Soil moisture records from COSMOS-UK sites are relatively short, with the earliest records starting in 2013 and the shortest in 2019 (Stanley et al., 2021). COSMOS-UK data are transferred from each site by telemetry and daily data are available in real-time on the UKWRP, i.e. for the previous full 24 h (Evans et al., 2016; Boorman et al., 2020).
4 Viewing Data in the UKWRP
The data in the UKWRP can be viewed on a map for individual days or months for data points (i.e. river flow gauges, boreholes or COSMOS-UK sites) or spatial areas (gauged catchment or river basin rainfall in addition to grid cells for the SPI). These are coloured according to the status for the given day or month as characterised by the raw data or standardised climate indices. The main functions and tools within the UKWRP are summarised in Figure 3.
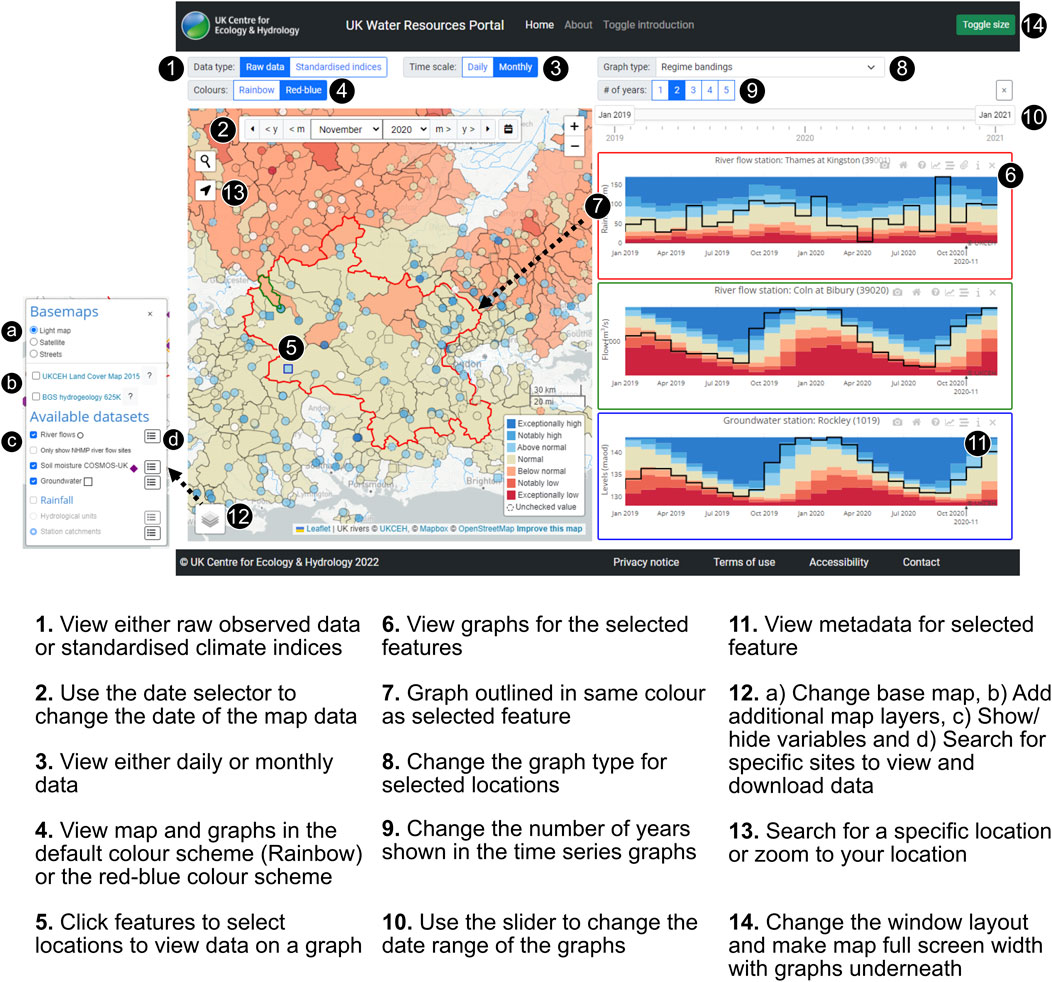
FIGURE 3. Summary of UK Water Resources Portal functionality and features.
In the default view when the Portal is loaded the hydrological status is summarised using regime bandings, which assess whether data for the given day or month is in the normal range, above or below normal (e.g. as shown in Figures 1C, 3). These regime bandings or categories are calculated by normalising the data for each site against its historic data, using a minimum of 20 years from start of the record to the end of December 2017 (currently). For each day, the values are ranked and the percentiles calculated (in the case of river flows, pooling all values in a 30-day period to reduce the influence of extreme daily values). The percentile values are then categorised to identify conditions that are: the normal range (28–72%), above/below normal (72–87%/13–28%), notably high/low (87–95%/5–13%) or exceptionally high/low (>95%/<5%). These bands correspond to those used in the Hydrological Summary for the UK.
For catchment rainfall this process is applied to the cumulative daily total from the start of the month, as this generally provides a more useful measure of the recent rainfall than a single daily value. For monthly data, monthly mean data (river flows and groundwater levels) or monthly total (rainfall) are used to calculate the bandings.
The date selector on the map allows users to step forwards and backwards in time to view how the hydrological status changes through time, and the temporal resolution of the map data and time series plots can switched from daily to monthly.
By clicking on individual features (e.g. catchments, boreholes, grid cells etc.), users can view time series data for up to four selected features (as shown in Figures 1C, 3). The selected feature is highlighted with a red, green, blue or yellow outline and the corresponding time series plot is outlined in the same colour. With the exception of soil moisture, by default the raw data are plotted against regime bandings which show whether flows, groundwater levels, soil moisture or rainfall totals for the given day or month are in the normal range, above or below normal.
Stakeholder engagement with the EA and South West Water particularly noted the importance of a range of plotting styles which enable users to view data within the UKWRP in a way that means they can use it in conjunction with existing products, tools and processes as well as enabling comparisons to previous years or drought events. Figure 4 shows the different types of time series plots available in the UKWRP for both raw data and the standardised climate indices. These include: 1) a simple time series plot, 2) a time series plot with the day/month recorded maximum and minimum and the long-term average as used in the NRFA/Hydrological Summary for the UK (raw data only), 3) regime bandings as described above which are used in the EA’s Water Situation Reports regularly used by the water supply sector as well as other users (raw data only), 4) comparisons to five pre-selected major drought events, and 5) the option for the use to select up to 3 years of their choice. The latter two options were highlighted as being of particular importance by users. In practice, water managers routinely assess the current situation (especially in droughts) through comparison with past events–whether recent droughts known from lived experience, or ‘droughts of record’, i.e. severe historical droughts used in drought plans to test the resilience of water supply systems.
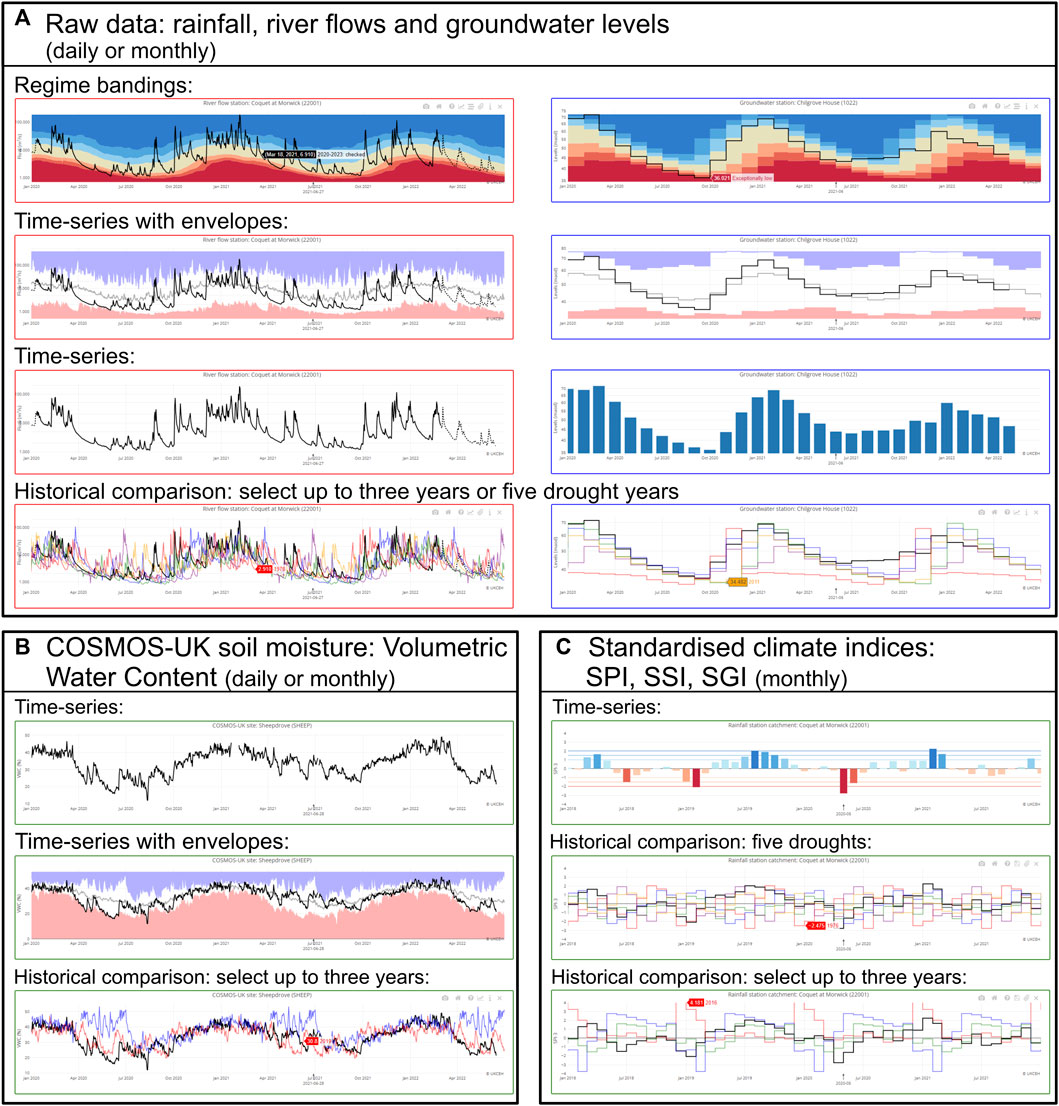
FIGURE 4. Examples of plot types in the UK Water Resources Portal showing (A) daily river flow data for the River Coquet at Morwick and monthly groundwater levels at Chilgrove House, (B) soil moisture data for the COSMOS-UK site at Sheepdrove, and (C) SPI-3 for the Coquet catchment.
Figure 3 also highlights features which allow users to change the base map, add additional layers such as UKCEH Land Cover Map 2015 (Rowland et al., 2017a; Rowland et al., 2017b) or the BGS Hydrogeology 625 k map10, as well as change the colour palette from the rainbow palette (used in existing products like the EA Water Situation Reports) to a red-blue palette which is accessible for (most) colour blind users. Individual graphs can be downloaded for use in reports, y-axes changed to from a log to a linear scale, and for river flows, the units changed from m3/s to mega litres per day (Ml/d).
5 UKWRP Infrastructure
The UKWRP is delivered through a combination of technologies to provide the functionality described in the section above. A summary of how these technologies are brought together is shown in Figure 5.
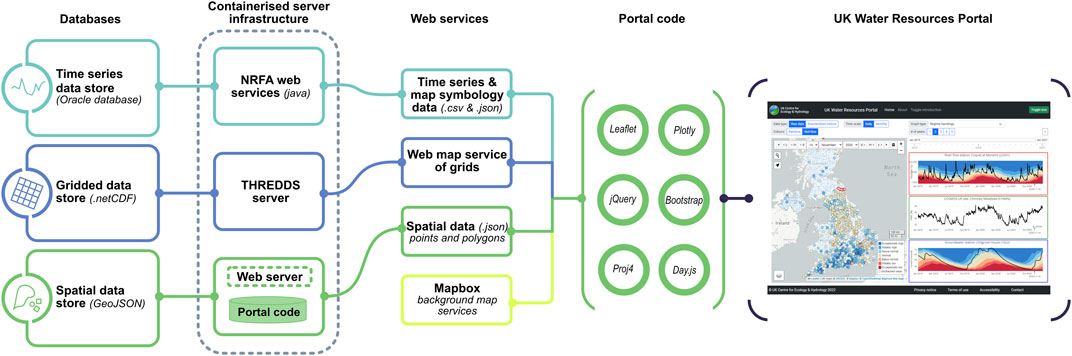
FIGURE 5. Infrastructure, processes and libraries used to build the UK Water Resources Portal.
5.1 Database
The majority of the underlying data for the UKWRP is stored within UKCEH’s Oracle database. River flow and rainfall for gauged catchments is stored within a database for the NRFA, and is also used to populate the NRFA website11. Historic river flow data within the archive is merged with real-time data downloaded from the EA Hydrology Data API, and updated on a daily basis. Rainfall series are derived and updated on a monthly basis from data provided by the NCIC. Data for COSMOS-UK stations is stored within a database for the wider COSMOS-UK monitoring project and is updated in near real-time from telemetry systems (Cooper et al., 2021), this database is also used to populate the COSMOS-UK website12. A specific database was created for additional data required specifically for the UKWRP such as the SPI and the other standardised climate indices. Each database is comprised of tables for the various spatial features displayed (i.e. river flow stations, groundwater boreholes, catchments, etc.) and their metadata, with separate time series tables for each type of feature. Monthly data series are pre-calculated and stored to improve the speed of delivery to the UKWRP.
Spatial datasets used within the UKWRP are largely static and as such as are accessed as files in GeoJSON format from a web server. These include boundaries for gauging station catchments relating to the locations at which flow data is displayed, and a more generic set of UK-wide river basins at two scales appropriate for different map zoom-levels (IHUs; hydrological areas—105 across the UK, and catchment groups—405 across the UK). Point locations for gauging stations, boreholes and COSMOS-UK soil moisture sites are available via web-services directly from the database.
The gridded SPI data is produced as monthly files in netCDF format and is managed using Unidata’s Thematic Real-time Environmental Distributed Data Services (THREDDS) data server (TDS)13. TDS is an open source web server that supports netCDF formats and provides metadata and data access for scientific datasets using a variety of remote data access protocols. TDS also supports several dataset collection services including aggregation capabilities, which are used by the UKWRP to link all files in the whole time series by creating a single virtual dataset, thereby simplifying the access to the data collection, and the monthly update process.
5.2 Web-Services
With the exception of static catchment boundary datasets, most data within the UKWRP is delivered to the application via web services. RESTful-style services (REpresentational State Transfer; an approach to providing simple, lightweight and responsive access to information over the web using URLs) deliver time series data of river flow, rainfall, soil moisture and groundwater levels in JSON format from the Oracle database and are implemented in the Java programming language. Whilst these services are bespoke, they are effectively extensions of the NRFA API14, supplemented with additional information required for use within the Portal. Three separate web service concepts deliver this data for each data type:
1 A JSON metadata service containing site location data for mapping as well as site name, and related information,
2 A site-time series service providing a csv format time series for plotting data within graphs and delivering downloads, and
3 A date-specific service providing data for all sites for a requested date (day or month) used for defining the colour and value of the sites on the map.
Gridded SPI data are delivered from the TDS using its standard Web Map Services (WMS) functionality that provides images of the data over the selected area. Time series for the gridded data are also accessed via WMS for a selected grid cell. Web services are also used to deliver contextual background mapping (from a commercial provider) as well as hydrologically-specific layers of rivers (from UKCEH 1:50 k river network), land cover (UKCEH Land Cover Map 2015, 1 km dominant class) and hydrogeology (British Geological Survey 1:625 k hydrogeology) from an ArcGIS server instance.
5.3 Web Application
The Portal interface is a bespoke JavaScript application, using Leaflet for mapping (with the PROJ library for handling projections), Plotly for graphing, and other widely used libraries including jQuery and Bootstrap. Catchment boundary geometries are simplified for faster rendering within the map. Graphing functionality is tailored specifically for this application (e.g. adding log/linear options for y-axes) and limiting some of the available Plotly options. In particular, the Plotly graph zooming is disabled and instead the graph x-axes are linked to a custom slider control which synchronises the graphs and means data for the selected features can be compared. Each graph can be exported as an image file by the user; and data downloads for selected sites are also enabled, using a simple csv format that includes full site metadata.
6 Benefits and Applications of the UKWRP
The UKWRP enables (near) real-time access to rainfall, river flow, groundwater level and soil moisture data for the UK at a range of spatial and temporal scales. This means that hydrological status monitoring information are freely and easily accessible to all, whether a water manager or water user (from farmers, business owners to members of the general public). The data availability and the Portal functionality deliver key MEW information for a range of users and applications in the context of water and drought monitoring and management. Quotes from users in Table 2 highlight some of the benefits and practical applications of the UKWRP that are discussed below. Some of these quotes pertain to the UKDP, the predecessor to the UKWRP described in Section 2—however, this functionality has been entirely subsumed into the UKWRP. The UKDP has been operational for longer, and was available during the significant drought in 2018. The UKDP has had a total of 11,750 page views since its operational release in June 2017 to the end of July 2021. In contrast the UKWRP, with the addition of real-time data and more variables, was viewed 16,647 times between March 2020 and July 2021—an average of over 1,000 users per month.
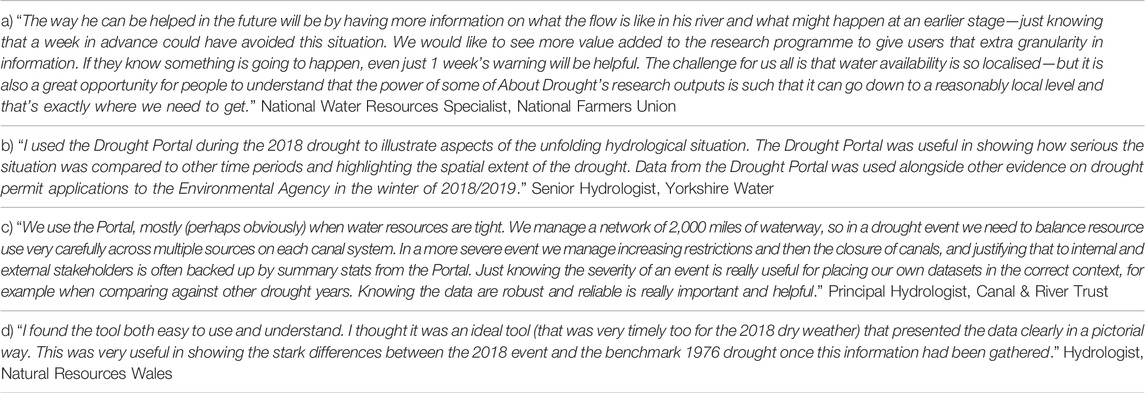
TABLE 2. User quotes on the UK Drought Portal and UK Water Resources Portal from AboutDrought (2021).
Live river flow data in England enables abstractors to view the same local scale data that is being used by the EA to monitor abstraction license conditions, meaning they can have greater confidence in when they are able to abstract water as well as help to plan ahead for potential abstraction restrictions. The real-time data available in the UKWRP provides much greater granularity and information at the local scale–this is beneficial for the agricultural sector, for example, where conditions can rapidly change in both time and space (as highlighted in Table 2). In addition to specific applications such as these, live river flow data in England on the UKWRP provide easy access to the real-time data, for all water, or river, users–for example, for assessing when conditions are suitable for canoeing, kayaking or angling etc.
The standardised climate indices included in the UKWRP, such as the SPI and SSI, form part of operational drought monitoring undertaken by water companies (e.g. Anglian Water where these indices form part of the drought management triggers set out in their drought plan; Anglian Water, 2021), and where the SPI is routinely used to prove exceptional shortage of rain supporting statutory drought permit applications (as highlighted in Table 2). The national coverage of the data means that even though the UKWRP datasets do not currently meet the statutory regulations for inclusion in drought permit applications (Environment Agency, 2021) those preparing applications can rapidly check local and regional figures against those seen at the larger scale and assess the severity of the rainfall deficits in the wider spatial context. The data used in these cases can be viewed in the local or regional context to support local scale decision making, but the availability of national scale data mean these data, and local scale situations can be viewed in the broader context. This ‘big picture’ view can be particularly beneficial when considering large-scale management options, such as bulk water transfers, or for supply chains affected by drought in one or more parts of the country.
The UKWRP not only provides access to an integrated assessment of current water resources at a range of spatial scales, but also allows the user to: compare current conditions to those of the past as highlighted in Table 2–whether by using the different graphing options (described in Section 4) to compare to previous high flow or drought events; explore the severity and spatial extent of past hydrological extremes; or view the full time series of the standardised climate indices (which are available for the period of record for the individual sites for SSI and SGI, or each rainfall dataset as shown in Table 1). The functionality and visualisation of the standardised climate indices is very similar to that used in the UKDP to ensure that established users of the UKDP could switch to the UKWRP without any loss of functionality. The benefits of national scale data, live data, a range of variables and historical comparisons available in the UKWRP are well demonstrated using case studies including the 2018 drought and the change from wet to dry conditions in 2019/2020.
The severity and impacts of the 2018 drought are well documented for the UK (Turner et al., 2021) and other parts of Europe (e.g. Bakke et al., 2020). Engagement with users (e.g. Table 2) demonstrated that the UKDP available at that time (now effectively replaced by the UKWRP) provided a useful tool to explore and compare conditions to those of the past. A key characteristic of 2018, was that although the summer was notably hot and dry, it was part of a longer term period of below normal precipitation, beginning in the winter of 2015/2016 (Turner et al., 2021). Long-term precipitation deficits (to varying degrees of severity) were evident in the 12–24 months accumulation periods of the SPI in the summer of 2018 (e.g. as shown for river basins in Figure 6A), with long-term deficits also evident in river flows and groundwater levels in the SSI and SGI, respectively).
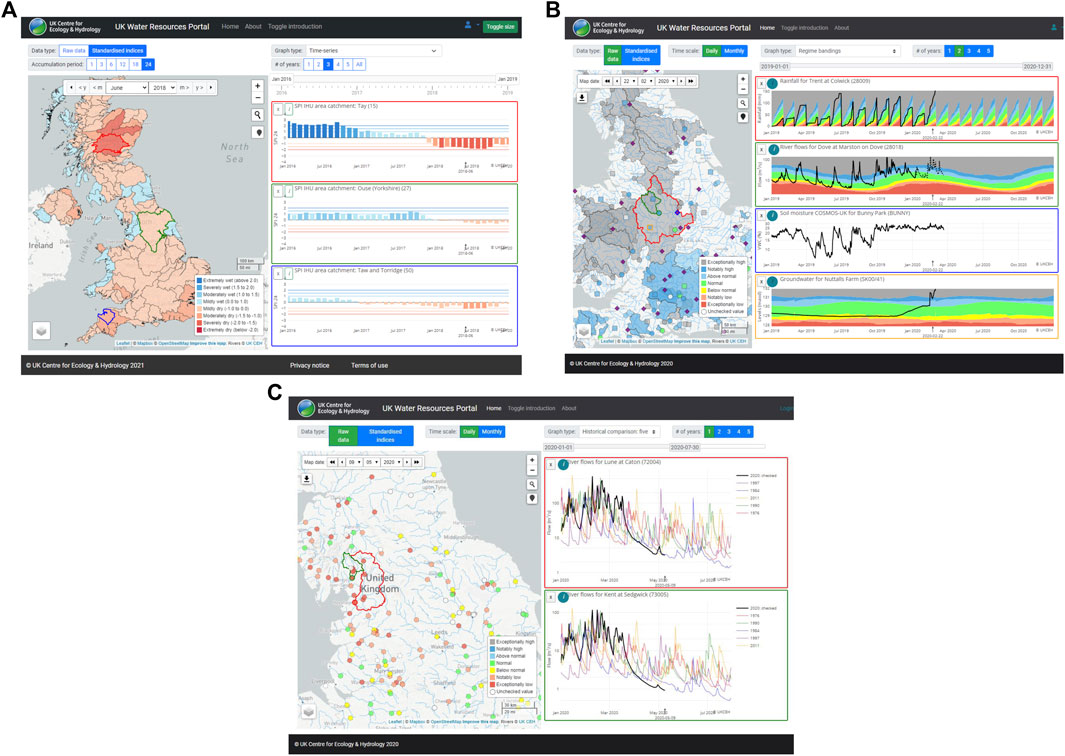
FIGURE 6. Screenshots of the UK Water Resources Portal showing (A) SPI-24 data for June 2018 for river basins, (B) rainfall, river flow, soil moisture and groundwater level data for February 2020 and (C) river flows compared to past drought events in May 2020. Note that the user interface has changed slightly since screen shots (B,C) were taken in 2020.
The benefits of the live data capabilities of the UKWRP were also highlighted in February 2020, when intense rainfall brought by a sequence of frontal systems contributed to the wettest February on record (in a series from 1910; Parry et al., 2020; Sefton et al., 2021). River flow data for the ∼500 gauges in England available at the time were updated within several days of the observation being recorded, and showed the rapid response of river flows to the intense rainfall. Figure 6B shows the UKWRP in late February 2020, showing exceptionally high rainfall and notably high river flows and groundwater levels in north-west England. This exceptionally wet start to 2020 was swiftly followed by an exceptionally dry spring (e.g. Figure 6C; Sefton et al., 2020; Turner et al., 2020), which in turn was followed by a wet start to the summer (Barker et al., 2020). Again, the dynamic features of the UKWRP demonstrated its utility in comparison to the static reports available at the time (such as the Hydrological Summary for the UK and EA Water Situation Reports), enabling users to step through time, view data for different variables and accumulation periods and in different formats and graphing styles.
The innovations and benefits of the UKWRP, and the functionality within, are also clear when compared to other status monitoring tools and products from around the world. Many hydrological data explorers and status assessment tools tend to show or visualise one dataset/time series at once (e.g. Australian Water Outlook15) and/or provide static maps or graphs. One exception is the USGS National Water Dashboard16, which provides access to a range of data from meteorological and hydrological monitoring stations across the United States via an interactive portal. However, it uses only one plotting style with simple time series graphs, with categories and bandings shown on the maps not shown on the available graphs. There are a significant number of drought specific monitoring products around the world, as catalogued by the Integrated Drought Management Programme17, including the US Drought Monitor (Svoboda et al., 2002), Czech Drought Monitor (Trnka et al., 2020), Drought Management Centre for Southeastern Europe18 and the predecessor to the UKWRP, the UK Drought Portal. While their drought focus is intended by design, and confers some advantages for drought-specific applications (see below), it inhibits the use of such products for monitoring across the flood-drought continuum. Very often these are static products (e.g. the USDM which can be viewed at the national and state scale), with limited user choice or flexibility, and/or are reliant on modelled data (e.g. the SPEI Global Drought Monitor19 and the German Drought Monitor20, Zink et al., 2016). In the UKWRP we present a flexible tool, which allows users to select the data type, variable, spatial and temporal scale of interest as well as the option to select how to view the selected data. This means the information can be used by various sectors and for different applications, as discussed above. The generic, extensible informatics architecture (Section 5) also means that it is also straightforward for new variables/indicators to be added, as evidenced by the growth of the UKWRP until now and the prospects for future evolution (Section 7).
Unlike other tools, such as the USDM, the UKWRP is not embedded into a particular operational decision-making framework–for example, it does not link directly to drought triggers or assistance payments. Rather, it is aimed at, and used by a wide range of users as demonstrated in Table 2 and noted above. The UKWRP is designed specifically to support decision-makers through the visualisations on offer (most notably the UK regulators and water industry by adopting flow regime bandings comparable to those used in decision-support and for example in the EA Water Situation Reports). The data and information within the portal is also referred to in water company drought plans (e.g. Southern Water, 2019a; Southern Water, 2019b; Anglian Water, 2021) and drought planning guidance provided by regulators in Wales (Natural Resources Wales, 2017).
7 Further Developments
The structure of the UKWRP and supporting databases mean that as more APIs become available from the UK environmental regulators there will be further developments to include more real-time data for river flows and groundwater levels, for example, real-time river flow data for Scotland via the SEPA time series data service21. Similar developments are in progress for adding real-time rainfall data in collaboration with the UK Met Office, whilst noting the additional challenges in updating the gridded products (from which catchment rainfall, for example, is derived) in real-time, which are currently updated at the monthly scale.
There are also opportunities for possible additions to the UKWRP to enhance its MEW capabilities. However, any future additions to the UKWRP will need to balance complexity of the user interface and usability whilst still meeting user needs, with options for developing specific services for individual user groups/sectors. There are a number of considerations to be borne in mind when making such decisions on further inclusion (e.g. including measured versus modelled data) so the following sections illustrate likely types of data that can be included, rather than any specific datasets. Furthermore, some of these developments are separate portals developed in parallel with the UKWRP (e.g. the Hydrological Outlook UK Portal) but using the same informatics systems, and which may be integrated in future or kept distinct–in effect this section provides a blueprint for further development of the UKWRP and related tools.
New variables from earth observation data: earth observation (EO) data provide the opportunity for consistent, national coverage of data–something that is not possible using ground observed data, particularly when considering variables such as vegetation condition indices (such as NDVI, VCI and VHI) that are not routinely monitored in situ. These indices are of particular interest for agricultural and environmental sectors, and the real-time nature and national coverage are advantageous for agricultural drought monitoring (which can start very quickly and have quite localised impacts) and associated impacts on crops and the terrestrial ecosystem (e.g. Bachmair et al., 2018).
Standardised Evapotranspiration Index (SPEI): the addition of the SPEI to the UKWRP would provide more comprehensive information on the water balance–this could be of particular use and interest in the south-east of England (e.g. Barker et al., 2016). Currently, data availability means that it is more challenging to calculate potential evapotranspiration in near-real-time based on observations. However, it is hoped that in the future, this would become possible, either through the use of remote sensing data or if the driving data necessary to calculate potential evapotranspiration (PET) becomes available in real-time.
Gridded datasets to “fill the gaps”: as well as EO data, hydrological models can also provide continuous fields that show spatiotemporal variability in “ungauged” areas not captured by the in-situ monitoring networks that make up the UKWRP at present (only precipitation is currently included as a gridded dataset). This is especially important for soil moisture. While COSMOS-UK provides a step-change in soil moisture sensing, there are still only ∼50 sites across the UK. However, COSMOS-UK can provide ground-truth for EO or model-based datasets that enable users to fill in the gaps. Several new soil moisture datasets are being developed within UKCEH, including a blended EO/model-based product (Peng et al., 2021) and a gridded model-based subsurface dryness map currently released as a static product within the Hydrological Outlook UK. Such products are being considered for inclusion on the UKWRP (and allied Hydrological Outlook UK Portal, see below) in the future–although as with EO data, uncertainty of model outputs is an important constraint.
Reservoir stocks: many parts of the UK are reliant on surface water stored in reservoirs for domestic and industrial water supplies. In the past, reservoir stocks were not shared publically, with the exception of data in static reports such as the Hydrological Summary for the UK or EA Water Situation Reports, however, in recent years, more data have been made available online. These data could be included in the UKWRP, again allowing users to compare current conditions to those of the past. However with the inclusion of reservoir data, it would be important to note changes in capacity, management or the impact of maintenance on available supplies.
Drought impact/incident data: stakeholder engagement on drought monitoring and early warning in the UK highlighted the need for a better understanding of when and where drought impacts occur (Hannaford et al., 2019). A range of impact and incident data and information are currently collected by, for example, the environmental regulators (e.g. water quality and macroinvertebrate monitoring data released via EA APIs), water companies and other organisations as well as via citizen science initiatives (such as CrowdWater22 and the Bloomin’ Algae app23). In the future, these could potentially be collated and shared via the UKWRP to provide water managers and decision makers additional information on the impact of the current conditions on society, the environment, agriculture, industry and so on.
Seasonal forecasts: in addition to better understanding of how severe the current conditions are, unsurprisingly stakeholders were interested in what was coming next (Hannaford et al., 2019). Correspondingly, a separate portal to view and explore outputs from the Hydrological Outlook UK24 (Prudhomme et al., 2017) has now been released25. This portal includes seasonal river flow forecasts from each of the Hydrological Outlook UK methods. The two Portals (i.e. UKWRP and Hydrological Outlook UK) are separate entities by design as the UKWRP contains observations, while the Hydrological Outlook UK Portal necessarily employs a range of statistical and process-based models. However, the design of the Hydrological Outlook UK Portal is very similar to the UKWRP in terms of interactivity, mapping and time series visualistion. Many of the same catchments are available in both the UKWRP and the Hydrological Outlook UK Portal, and links between the two portals enable the forecasts to be visualised for the next 3 months (up to 12 months) in the context of the current conditions by toggling between the two.
The development of the UKWRP has fed into and supported the development of other tools, such as the Hydrological Outlook UK Portal mentioned above, but also a global Hydrological Status and Outlook System (HydroSOS) demonstration portal26 within the World Meteorological Organization (WMO) HydroSOS initiative27, the implementation phase of which was approved in 2021. Through this work HydroSOS is demonstrating how data on hydrological conditions from a range of scales, from global to national and regional, can be blended to provide the best information for monitoring global surface and groundwater status (Jenkins et al., 2020). The development of the UKWRP is helping to understand how information produced to meet national requirements can also deliver information through a federated “system of systems” to improve understanding of water resources at a global scale within a global system such as HydroSOS.
Data Availability Statement
The original contributions presented in the study are included in the article/supplementary material, further inquiries can be directed to the corresponding author.
Author Contributions
This paper was written by LB, JH, and MF, with contributions from GN, MT, and OS.
Funding
The UK Water Resources Portal was primarily developed in the ENDOWS project (Engaging diverse stakeholders and publics with outputs from the UK Drought and Water Scarcity Programme), funded by the Natural Environment Research Council award number NE/L01016X/1. Additional funding was provided by the Natural Environment Research Council award number NE/R016429/1 as part of the UK-SCAPE programme delivering National Capability.
Conflict of Interest
The authors declare that the research was conducted in the absence of any commercial or financial relationships that could be construed as a potential conflict of interest.
Publisher’s Note
All claims expressed in this article are solely those of the authors and do not necessarily represent those of their affiliated organizations, or those of the publisher, the editors and the reviewers. Any product that may be evaluated in this article, or claim that may be made by its manufacturer, is not guaranteed or endorsed by the publisher.
Acknowledgments
We gratefully acknowledge the providers of data used in the for the UKWRP: NRFA river flow and BGS groundwater level data provided by the Environment Agency (for England), Natural Resources Wales, the Scottish Environmental Protection Agency and Department of Infrastructure - Rivers in Northern Ireland, the Met Office NCIC for rainfall and UKCEH for COSMOS-UK for soil moisture. We acknowledge the contributions of David Boorman (UKCEH) for their efforts and collaboration in providing the COSMOS-UK soil moisture data. We thank all those who have contributed to the development of the UK Water Resources Portal by providing feedback and/or by attending and contributing to workshops. Particular thanks to the Environment Agency and South West Water for contributions during the South West Water Resources Demonstrator Portal phase.
Footnotes
2For example: https://flood-warning-information.service.gov.uk/warnings.
3https://eip.ceh.ac.uk/hydrology/water-resources/.
4https://www.ceh.ac.uk/our-science/projects/driver.
5https://eip.ceh.ac.uk/apps/droughts/.
7https://environment.data.gov.uk/hydrology/doc/reference.
8https://environment.data.gov.uk/hydrology.
10https://www.bgs.ac.uk/datasets/hydrogeology-625k/.
13https://www.unidata.ucar.edu/software/tds/.
14https://nrfaapps.ceh.ac.uk/nrfa/nrfa-api.html.
16https://dashboard.waterdata.usgs.gov/app/nwd/.
17https://www.droughtmanagement.info/pillars/monitoring-early-warning/.
18http://www.dmcsee.org/en/drought_monitor/.
19https://spei.csic.es/map/maps.html.
20https://www.ufz.de/index.php?en=37937.
21https://timeseriesdoc.sepa.org.uk/.
22https://crowdwater.ch/en/start/.
23https://www.ceh.ac.uk/our-science/projects/bloomin-algae.
25https://eip.ceh.ac.uk/hydrology/outlooks/.
26https://eip.ceh.ac.uk/hydrology/HydroSOS/.
27https://public.wmo.int/en/our-mandate/what-we-do/application-services/hydrosos.
References
AboutDrought (2021). AboutDrought Brief: Drought Monitoring and Early Warning: New Developments to Meet User Needs. Available at: https://aboutdrought.info/about-us/publications/briefing-notes/(Accessed July 27, 2021).
Anglian Water (2021). Drought Plan 2022. Available at: https://www.anglianwater.co.uk/about-us/our-strategies-and-plans/drought-plan/(Accessed: July 22, 2021).
Bachmair, S., Tanguy, M., Hannaford, J., and Stahl, K. (2018). How Well Do Meteorological Indicators Represent Agricultural and Forest Drought across Europe? Environ. Res. Lett. 13 (3), 034042. doi:10.1088/1748-9326/aaafda
Bakke, S. J., Ionita, M., and Tallaksen, L. M. (2020). The 2018 Northern European Hydrological Drought and its Drivers in a Historical Perspective. Hydrol. Earth Syst. Sci. 24 (11), 5621–5653. doi:10.5194/hess-24-5621-2020
Barker, L. J., Hannaford, J., Chiverton, A., and Svensson, C. (2016). From Meteorological to Hydrological Drought Using Standardised Indicators. Hydrol. Earth Syst. Sci. 20 (6), 2483–2505. doi:10.5194/hess-20-2483-2016
Barker, L., Muchan, K., Crane, E., and Clemas, S. (2020). Hydrological Summary for the United Kingdom: June 2020. Wallingford, United Kingdom: UK Centre for Ecology & Hydrology. Available at: http://nora.nerc.ac.uk/id/eprint/528176/.
Bloomfield, J. P., and Marchant, B. P. (2013). Analysis of Groundwater Drought Building on the Standardised Precipitation Index Approach. Hydrol. Earth Syst. Sci. 17 (12), 4769–4787. doi:10.5194/hess-17-4769-2013
Boorman, D. (2020). COSMOS-UK User Guide v3.03. Wallingford. Available at: https://cosmos.ceh.ac.uk/resources (Accessed: July 28, 2021).
Cooper, H. M., Bennett, E., Blake, J., Blyth, E., Boorman, D., Cooper, E., et al. (2021). COSMOS-UK: National Soil Moisture and Hydrometeorology Data for Environmental Science Research. Earth Syst. Sci. Data 13 (4), 1737–1757. doi:10.5194/essd-13-1737-2021
Dixon, H., Hannaford, J., and Fry, M. J. (2013). The Effective Management of National Hydrometric Data: Experiences from the United Kingdom. Hydrological Sci. J. 58 (7), 1383–1399. doi:10.1080/02626667.2013.787486
Dixon, H., Sandström, S., Cudennec, C., Lins, H. F., Abrate, T., Bérod, D., et al. (2020). Intergovernmental Cooperation for Hydrometry – What, Why and How?. Hydrological Sci. J. doi:10.1080/02626667.2020.1764569
Environment Agency (2021). Drought: How Water Companies Plan for Dry Weather and Drought. Available at: https://www.gov.uk/government/publications/drought-managing-water-supply/drought-how-water-companies-plan-for-dry-weather-and-drought (Accessed: July 30, 2021).
Evans, J. G., Ward, H. C., Blake, J. R., Hewitt, E. J., Morrison, R., Fry, M., et al. (2016). Soil Water Content in Southern England Derived from a Cosmic-Ray Soil Moisture Observing System - COSMOS-UK. Hydrol. Process. 30 (26), 4987–4999. doi:10.1002/hyp.10929
Grainger, S., Murphy, C., and Vicente-Serrano, S. M. (2021). Barriers and Opportunities for Actionable Knowledge Production in Drought Risk Management: Embracing the Frontiers of Co-production. Front. Environ. Sci. 9, 62. doi:10.3389/fenvs.2021.602128
Hannaford, J., Collins, K., Haines, S., and Barker, L. J. (2019). Enhancing Drought Monitoring and Early Warning for the United Kingdom through Stakeholder Coinquiries. Weather, Clim. Soc. 11 (1), 49–63. doi:10.1175/WCAS-D-18-0042.1
Hao, Z., Yuan, X., Xia, Y., Hao, F., and Singh, V. P. (2017). An Overview of Drought Monitoring and Prediction Systems at Regional and Global Scales. Bull. Am. Meteorological Soc. 98 (9), 1879–1896. doi:10.1175/BAMS-D-15-00149.1
Hayes, M., Svoboda, M., Wall, N., and Widhalm, M. (2011). The Lincoln Declaration on Drought Indices: Universal Meteorological Drought Index Recommended. Bull. Am. Meteorological Soc. 92 (4), 485–488. doi:10.1175/2010BAMS3103.1
Jenkins, A., Dixon, H., Barlow, V., Smith, K., Cullmann, J., Berod, D., et al. (2020). HydroSOS–the Hydrological Status and Outlook System towards Providing Information for Better Water Management. WMO Bull. 69 (1), 14–19. Available at: https://public.wmo.int/en/resources/bulletin/hydrosos-–-hydrological-status-and-outlook-system.
Lloyd-Hughes, B. (2014). The Impracticality of a Universal Drought Definition. Theor. Appl. Climatol. 117 (3), 607–611. doi:10.1007/s00704-013-1025-7
McKee, T. B., Doesken, N. J., and Kleist, J. (1993). “The Relationship of Drought Frequency and Duration to Time Scales,” in Proceedings of the 8th Conference on Applied Climatology, Anaheim, CA, January 17–22, 1993 (Boston, 179–183. Available at: https://www.droughtmanagement.info/literature/AMS_Relationship_Drought_Frequency_Duration_Time_Scales_1993.pdf.
National River Flow Archive (2014). Integrated Hydrological Units of the United Kingdom: Hydrometric Areas with Coastline. NERC Environmental Information Data Centre. doi:10.5285/1957166d-7523-44f4-b279-aa5314163237
Natural Resources Wales (2017). Water Company Drought Plan Technical Guideline. Cardiff, United Kingdom: Natural Resources Wales. Available at: https://naturalresources.wales/media/684414/final-wc-drought-plan-guidance-2017.pdf.
Parry, S., Barker, L., Sefton, C., Hannaford, J., Turner, S., Muchan, K., et al. (2020). Briefing Note: Severity of the February 2020 Floods - Preliminary Analysis. Wallingford, United Kingdom: UK Centre for Ecology & Hydrology. Available at: http://nora.nerc.ac.uk/id/eprint/527460/.
Peng, J., Tanguy, M., Robinson, E. L., Pinnington, E., Evans, J., Ellis, R., et al. (2021). Estimation and Evaluation of High-Resolution Soil Moisture from Merged Model and Earth Observation Data in the Great Britain. Remote Sens. Environ. 264, 112610. doi:10.1016/j.rse.2021.112610
Prudhomme, C., Hannaford, J., Harrigan, S., Boorman, D., Knight, J., Bell, V., et al. (2017). Hydrological Outlook UK: an Operational Streamflow and Groundwater Level Forecasting System at Monthly to Seasonal Time Scales. Hydrological Sci. J. 62 (16), 2753–2768. doi:10.1080/02626667.2017.1395032
Pulwarty, R. S., and Sivakumar, M. V. K. (2014). Information Systems in a Changing Climate: Early Warnings and Drought Risk Management. Weather Clim. Extrem. 3, 14–21. doi:10.1016/j.wace.2014.03.005
Robins, L., Burt, T. P., Bracken, L. J., Boardman, J., and Thompson, D. B. A. (2017). Making Water Policy Work in the United Kingdom: A Case Study of Practical Approaches to Strengthening Complex, Multi-Tiered Systems of Water Governance. Environ. Sci. Policy 71, 41–55. doi:10.1016/j.envsci.2017.01.008
Rowland, C. S., Morton, R. D., Carrasco, L., McShane, G., O’Neil, A. W., and Wood, C. M. (2017a). Land Cover Map 2015 (1km Dominant Aggregate Class, GB). NERC Environmental Information Data Centre. doi:10.5285/711c8dc1-0f4e-42ad-a703-8b5d19c92247
Rowland, C. S., Morton, R. D., Carrasco, L., McShane, G., O’Neil, A. W., and Wood, C. M. (2017b). Land Cover Map 2015 (1km Dominant Aggregate Class, N. Ireland). NERC Environmental Information Data Centre. doi:10.5285/c38b3986-b67e-40e9-9026-85ddbe3830d3
Sefton, C., Matthews, B., Lewis, M., and Clemas, S. (2020). Hydrological Summary for the United Kingdom: May 2020. Wallingford, United Kingdom: UK Centre for Ecology & Hydrology. Available at: http://nora.nerc.ac.uk/id/eprint/527958/.
Sefton, C., Muchan, K., Parry, S., Matthews, B., Barker, L. J., Turner, S., et al. (2021). The 2019/2020 Floods in the UK : a Hydrological Appraisal. Weather 76, 378–384. doi:10.1002/wea.3993
Southern Water (2019a). Drought Plan 2019. Available at: https://www.southernwater.co.uk/our-story/water-resources-planning/our-drought-plan (Accessed June 13, 2022).
Southern Water (2019b). Drought Plan 2019 Annex 1 : Drought Monitoring and Trigger Levels. Available at: https://www.southernwater.co.uk/our-story/water-resources-planning/our-drought-plan (Accessed June 13, 2022).
Stanley, S., Antoniou, V., Askquith-Ellis, A., Ball, L. A., Bennett, E. S., Blake, J. R., et al. (2021). Daily and Sub-daily Hydrometeorological and Soil Data (2013-2019) [COSMOS-UK]. NERC Environmental Information Data Centre. doi:10.5285/b5c190e4-e35d-40ea-8fbe-598da03a1185
Svensson, C., Hannaford, J., and Prosdocimi, I. (2017). Statistical Distributions for Monthly Aggregations of Precipitation and Streamflow in Drought Indicator Applications. Water Resour. Res. 53 (2), 999–1018. doi:10.1002/2016WR019276
Svoboda, M., LeComte, D., Hayes, M., Heim, R., Gleason, K., Angel, J., et al. (2002). The Drought Monitor. Bull. Amer. Meteor. Soc. 83 (8), 1181–1190. doi:10.1175/1520-0477-83.8.1181
Tanguy, M., Fry, M., Svensson, C., and Hannaford, J. (2017a). Historic Gridded Standardised Precipitation Index for the United Kingdom 1862-2015 (Generated Using Gamma Distribution with Standard Period 1961-2010) V4. NERC Environmental Information Data Centre. doi:10.5285/233090b2-1d14-4eb9-9f9c-3923ea2350ff
Tanguy, M., Fry, M., Svensson, C., and Hannaford, J. (2017b). Historic Standardised Precipitation Index Time Series for IHU Groups (1862-2015) V2. NERC Environmental Information Data Centre. doi:10.5285/a01e09b6-4b40-497b-a139-9369858101b3
Tanguy, M., Fry, M., Svensson, C., and Hannaford, J. (2017c). Historic Standardised Precipitation Index Time Series for IHU Hydrometric Areas (1862-2015) V2. NERC Environmental Information Data Centre. doi:10.5285/a754cae2-d6a4-456e-b367-e99891d7920f
Tanguy, M., Hannaford, J., Barker, L., Svensson, C., Kral, F., and Fry, M. (2015). Gridded Standardized Precipitation Index (SPI) Using Gamma Distribution with Standard Period 1961-2010 for Great Britain [SPIgamma61-10]. NERC Environmental Information Data Centre. doi:10.5285/94c9eaa3-a178-4de4-8905-dbfab03b69a0
Tauro, F., Selker, J., van de Giesen, N., Abrate, T., Uijlenhoet, R., Porfiri, M., et al. (2018). Measurements and Observations in the XXI Century (MOXXI): Innovation and Multi-Disciplinarity to Sense the Hydrological Cycle. Hydrological Sci. J. 63 (2), 169–196. doi:10.1080/02626667.2017.1420191
Trnka, M., Hlavinka, P., Možný, M., Semerádová, D., Štěpánek, P., Balek, J., et al. (2020). Czech Drought Monitor System for Monitoring and Forecasting Agricultural Drought and Drought Impacts. Int. J. Climatol. 40, 5941–5958. doi:10.1002/joc.6557
Turner, S., Barker, L., Hannaford, J., Matthews, B., Muchan, K., Parry, S., et al. (2020). UK Hydrological Status Update - May 2020, UKCEH Blog Post. Available at: https://www.ceh.ac.uk/news-and-media/blogs/uk-hydrological-status-update-may-2020 (Accessed: July 28, 2021).
Turner, S., Barker, L. J., Hannaford, J., Muchan, K., Parry, S., and Sefton, C. (2021). The 2018/2019 Drought in the UK: a Hydrological Appraisal. Weather 76, 248–253. doi:10.1002/wea.4003
Vicente-Serrano, S. M., López-Moreno, J. I., Beguería, S., Lorenzo-Lacruz, J., Azorin-Molina, C., and Morán-Tejeda, E. (2012). Accurate Computation of a Streamflow Drought Index. J. Hydrol. Eng. 17 (2), 318–332. doi:10.1061/(asce)he.1943-5584.0000433
Wilhite, D. (2014). “Drought: Past and Future,” in Drought in the Life, Cultures, and Landscapes of the Great Plains (Lincoln, Nebraska: University of Nebraska-Lincoln).
World Meteorological Organization (2020). 2020 State of Climate Services. Geneva, Switzerland: WMO. No. 1252. Available at: https://public.wmo.int/en/resources/library/2020-state-of-climate-services-report.
Keywords: water resources, early warning, status monitoring, drought, floods
Citation: Barker LJ, Fry M, Hannaford J, Nash G, Tanguy M and Swain O (2022) Dynamic High Resolution Hydrological Status Monitoring in Real-Time: The UK Water Resources Portal. Front. Environ. Sci. 10:752201. doi: 10.3389/fenvs.2022.752201
Received: 02 August 2021; Accepted: 20 May 2022;
Published: 16 August 2022.
Edited by:
Vimal Mishra, Indian Institute of Technology Gandhinagar, IndiaReviewed by:
Wei Sun, Sun Yat-Sen University, ChinaSaran Aadhar, Hebrew University of Jerusalem, Israel
Copyright © 2022 Barker, Fry, Hannaford, Nash, Tanguy and Swain. This is an open-access article distributed under the terms of the Creative Commons Attribution License (CC BY). The use, distribution or reproduction in other forums is permitted, provided the original author(s) and the copyright owner(s) are credited and that the original publication in this journal is cited, in accordance with accepted academic practice. No use, distribution or reproduction is permitted which does not comply with these terms.
*Correspondence: Lucy J. Barker, lucybar@ceh.ac.uk